IMAGE

Figure 6

ID
ZDB-IMAGE-191230-963
Source
Figures for Kobayashi et al., 2019
Image
Figure Caption

Figure 6

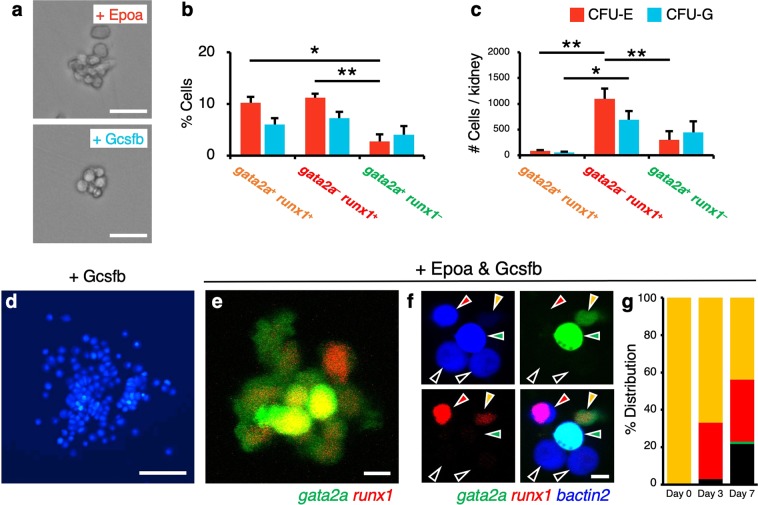
Colony-forming assays of HSPC populations. (a) Representative images of a colony formed in the presence of Epoa (CFU-E) or Gcsfb (CFU-G). (b,c) Percentage (b) and absolute number (c) of CFU-E (red bars) and CFU-G (blue bars) in gata2a+runx1+, gata2arunx1+, or gata2a+runx1 cells in the kidney. Data are shown as mean ± s.e.m. *p < 0.01; **p < 0.001 by one-way ANOVA with Dunnett’s test. (d) Representative image of a large colony observed in the well plated with gata2a+runx1+ cells in the presence of Gcsfb. The image shows cells expressing BFP. (e,f) Representative images of a colony formed by gata2a+runx1+ cells in the presence of both Epoa and Gcsfb. Orange, red, green, and black arrowheads in (f) indicate gata2a+runx1+, gata2arunx1+, gata2a+runx1, and gata2arunx1 cells, respectively. (g) Percent distribution of individual GFP+ mCherry+ (orange bar), GFP mCherry+ (red bar), GFP+ mCherry (green bar), and GFP mCherry (black bar) cells at day 0, 3, and 7 of culture. Bars, 20 μm (a), 100 μm (d), 5 μm (e,f).

Acknowledgments
This image is the copyrighted work of the attributed author or publisher, and ZFIN has permission only to display this image to its users. Additional permissions should be obtained from the applicable author or publisher of the image. Full text @ Sci. Rep.