IMAGE

Figure 5

ID
ZDB-IMAGE-191230-962
Source
Figures for Kobayashi et al., 2019
Image
Figure Caption

Figure 5

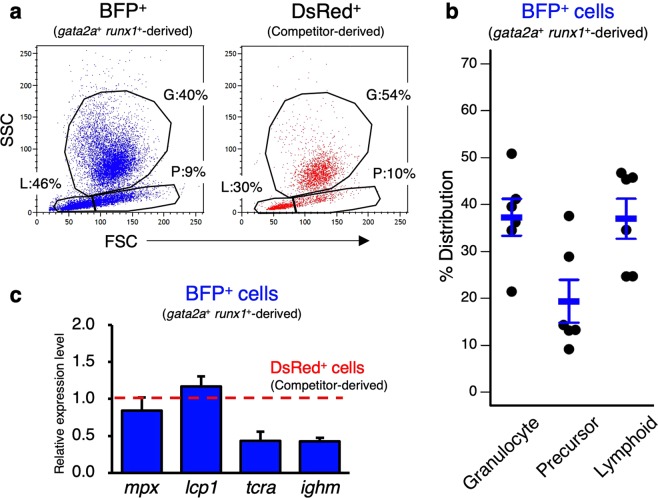
Multilineage differentiation of gata2a+runx1+ cells. (a) Representative result of FCM analysis of KMCs in a recipient co-transplanted with BFP-labeled gata2a+runx1+ cells and DsRed-labeled competitors. G, granulocyte; P, precursor; L, lymphoid. (b) Percent distribution of gata2a+runx1+-derived BFP+ cells in “granulocyte”, “precursor”, and “lymphoid”. Data show the mean ± s.e.m. in the recipients (n = 6). (c) Relative expression level of lineage marker genes in isolated gata2a+runx1+-derived BFP+ cells in a recipient. Red dotted line indicates the expression level of each gene in competitor-derived DsRed+ cells.

Acknowledgments
This image is the copyrighted work of the attributed author or publisher, and ZFIN has permission only to display this image to its users. Additional permissions should be obtained from the applicable author or publisher of the image. Full text @ Sci. Rep.