
Image
|
Figure Caption
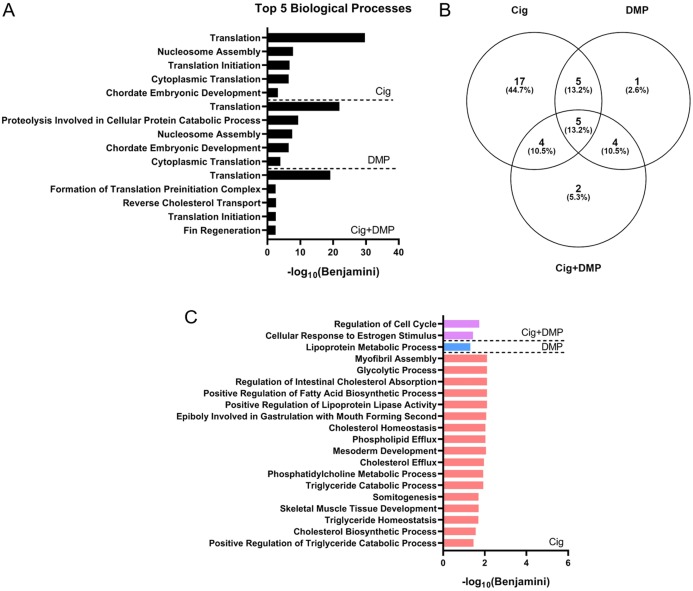
Figure 7
Top 5 DAVID-identified biological processes (based on significantly different transcripts) following exposure to 12.5 µM ciglitazone, 0.078 µM DMP, or 0.078 µM DMP + 12.5 µM ciglitazone (A). Venn diagram showing the number and percent of significantly altered biological processes among treatment groups (B). Significant (Benjamini < 0.05) biological processes unique to each treatment group (C).
Acknowledgments
This image is the copyrighted work of the attributed author or publisher, and
ZFIN has permission only to display this image to its users.
Additional permissions should be obtained from the applicable author or publisher of the image.
Full text @ Peer J.