IMAGE

Fig. 5

ID
ZDB-IMAGE-191230-911
Source
Figures for McCarroll et al., 2019
Image
Figure Caption

Fig. 5

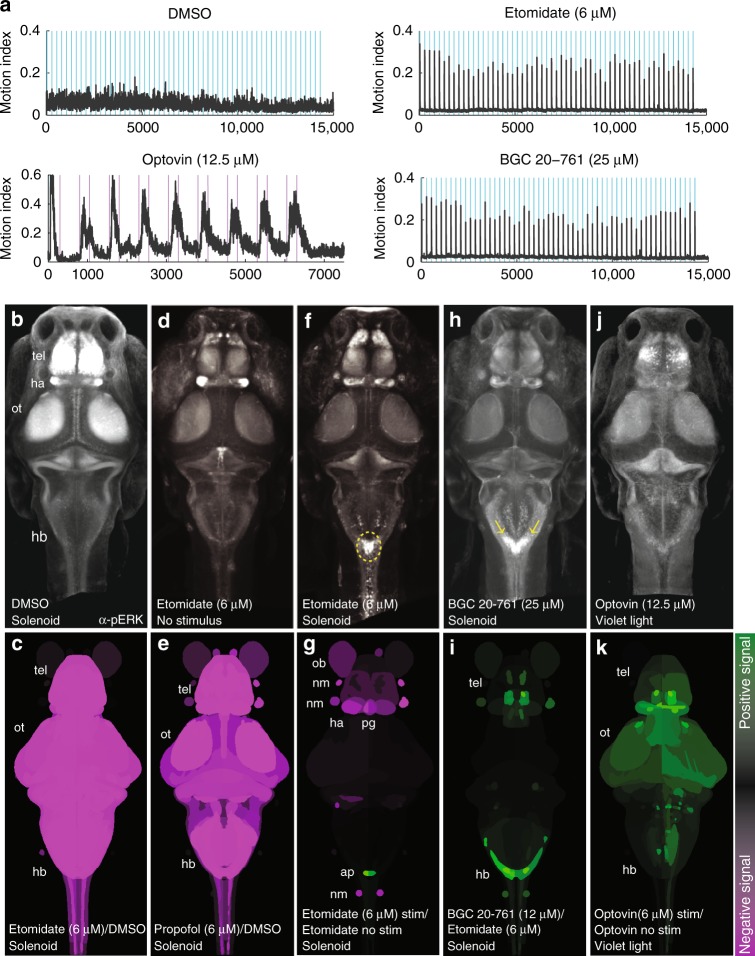
Hit compounds activate hindbrain neurons. Animals were exposed to the indicated drugs and stimuli and analyzed for pERK levels as a readout of neuronal activity. a Plots showing motor activity (y-axis) over time (x-axis) for animals treated with the indicated compounds (n = 25–50 larvae) in response to the indicated acoustic (blue) or violet light (purple) stimuli. b, d, f, h, j Confocal projections showing the average fluorescent intensity of image registered larval brains stained with α-pERK (n = 10 larvae/condition). Larvae were treated with the indicated compounds and exposed to the low-amplitude acoustic stimulus once every 10 s for 10 min, except for (b, no stimulus) and (f, violet light exposure). c, e, g, i, k Brain activity maps showing significant ΔpERK signals using the Z-brain online reference tool (n = 5–10 animals/condition). The heatmap indicates positive (green), negative (purple), and nonsignificant (black) changes in pERK labeling (P< 0.0005, Mann–Whitney U test). All activity maps are comparisons between the indicated treatment conditions. Abbreviations: tel, telencephalon; ot, optic tectum; hb, hindbrain; ob, olfactory bulb; nm, neuromast; ap, area postrema; pg, pineal gland

Acknowledgments
This image is the copyrighted work of the attributed author or publisher, and ZFIN has permission only to display this image to its users. Additional permissions should be obtained from the applicable author or publisher of the image. Full text @ Nat. Commun.