IMAGE

Fig. 4

ID
ZDB-IMAGE-191230-873
Source
Figures for Bornhorst et al., 2019
Image
Figure Caption

Fig. 4

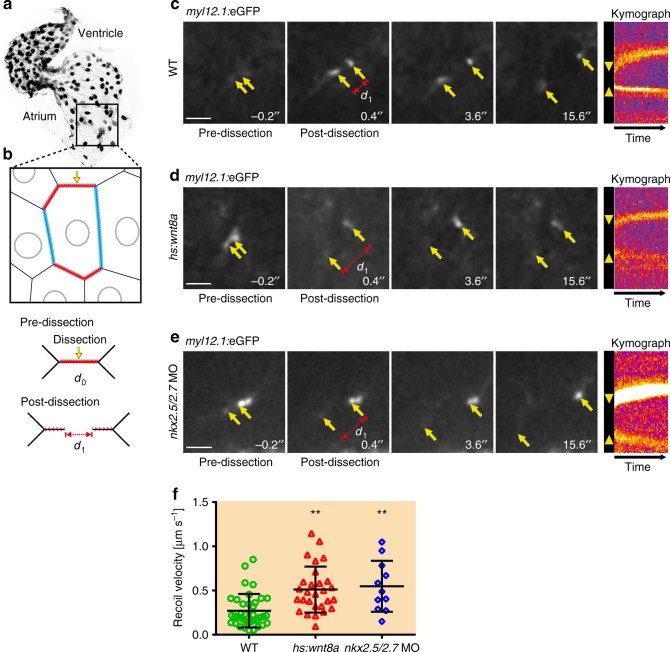
Endocardial tissue tension increases upon Wnt8a overexpression or loss of Nkx2.5/Nkx2.7. a, b Schematic model illustrating the endocardial region in which the laser cuts were performed. Local laser cut (yellow arrow) of the subcortical actomyosin network within the shorter membrane compartment (red) which is oriented perpendicular to the direction of intra-cardiac blood flow at time point d0 causes an actomyosin recoil (d1). ce Time lapse sequences following a laser cut within the endocardium of 40 hpf embryos with the Tg(act2:myl12.1-EGFP)e2212 transgenic reporter that marks the actomyosin network. Yellow arrows show the actomyosin recoil distance within 0.4 ms upon laser dissection. Kymographs indicate the temporal recoil of the actomyosin network along the membrane compartment where the laser cut was performed. The recoil of the open junction ends is visualized with the fluorescence intensity and the initial opening of the junction is marked by yellow arrowheads. d, e Time lapse analyses demonstrate a larger opening of the junction (d1) and a faster recoil of the actomyosin network (yellow arrowheads in the kymograph) upon Wnt8a overexpression or loss of Nkx2.5/Nkx2.7 following laser cuts. Scale bars, 20 μm. f Comparison of initial recoil velocities (μm per sec) which are lower in WT (n = 37 hearts) compared with Wnt8a overexpressing embryos (n = 28 hearts) or upon loss of Nkx2.5/Nkx2.7 (n = 11 hearts). Mean values ± SD are shown. One-way ANOVA was used to compare each condition with WT (**p < 0.001)

Acknowledgments
This image is the copyrighted work of the attributed author or publisher, and ZFIN has permission only to display this image to its users. Additional permissions should be obtained from the applicable author or publisher of the image. Full text @ Nat. Commun.