IMAGE

Figure 4

ID
ZDB-IMAGE-191230-801
Source
Figures for Xie et al., 2019
Image
Figure Caption

Figure 4

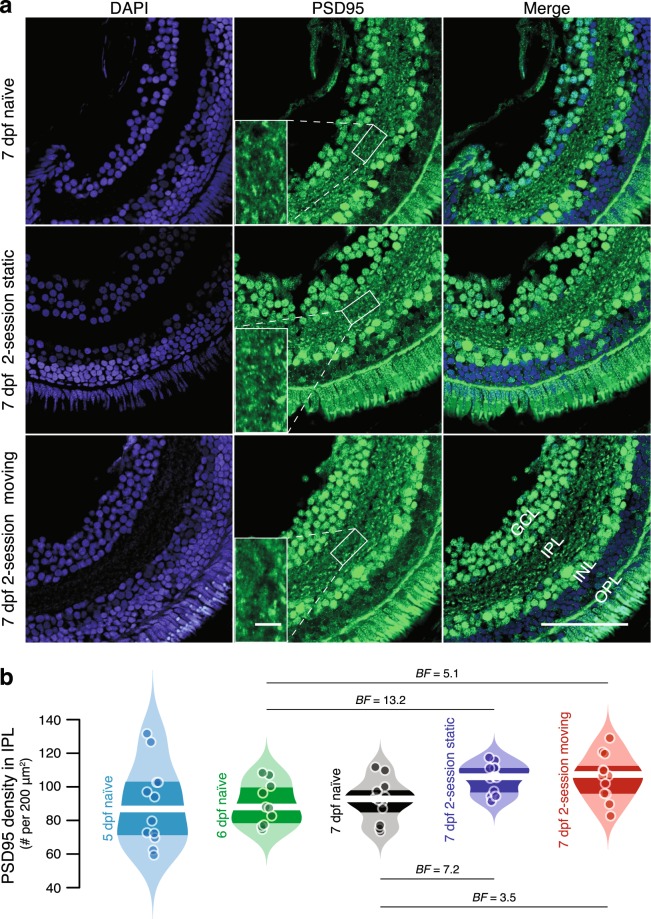
PSD-95 in the retinal IPL of visually naïve and experienced larvae from 5 to 7 dpf. (a) Example confocal images of 7 dpf retinae stained with DAPI (blue) and PSD-95 (green) in naïve (top row), 2-session static experienced (middle row) and 2-session moving experienced (bottom row) larvae. The larger scale bar (bottom right) represents 50 µm. Example cropped images for puncta analysis are also shown in the middle column, with the smaller scale bar representing 5 µm. Sections show the ganglion cell layer (GCL), inner nuclear layer (INL), inner plexiform layer (IPL), and outer plexiform layer (OPL). (b) Violin plots of PSD-95 density in 5 to 7 dpf visually naïve and experienced larvae. Points are individual retinae, white lines represent medians and dark bands indicate the inter-quartile range. Bayes Factors (BF) >3, considered as evidence in favour of a difference between groups, are shown.

Acknowledgments
This image is the copyrighted work of the attributed author or publisher, and ZFIN has permission only to display this image to its users. Additional permissions should be obtained from the applicable author or publisher of the image. Full text @ Sci. Rep.