IMAGE

Fig. 7

ID
ZDB-IMAGE-191230-682
Source
Figures for Wu et al., 2019
Image
Figure Caption

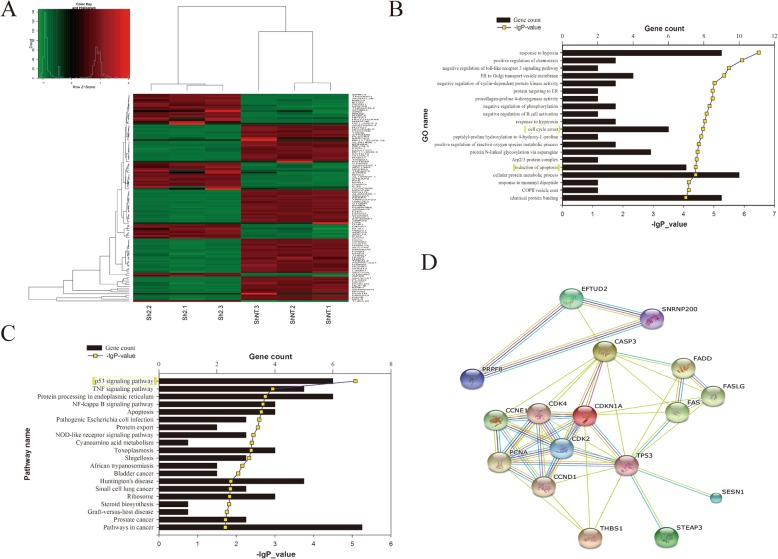
Fig. 7

RNA-Seq analysis in HCO cells. a Hierarchical cluster heatmap of Z-scores for relevant genes between the sh2 and shNT groups, each of which includes three samples (sh2-1, sh2-2, sh2-3; shNT-1, shNT-2, shNT-3). b GO annotation revealed the most significant enrichment (P < 0.001), among which “cell cycle arrest” and “induction of apoptosis” were directly associated with cell development. c KEGG metabolic pathway categories with a significant P value; the P53 pathway was predicted to be the most likely (P < 0.001). d Protein interactions between EFTUD2 and the P53 pathway determined by the STRING website

Acknowledgments
This image is the copyrighted work of the attributed author or publisher, and ZFIN has permission only to display this image to its users. Additional permissions should be obtained from the applicable author or publisher of the image. Full text @ Hum. Genomics