IMAGE

Fig. 4

ID
ZDB-IMAGE-191230-49
Source
Figures for Hu et al., 2019
Image
Figure Caption

Fig. 4

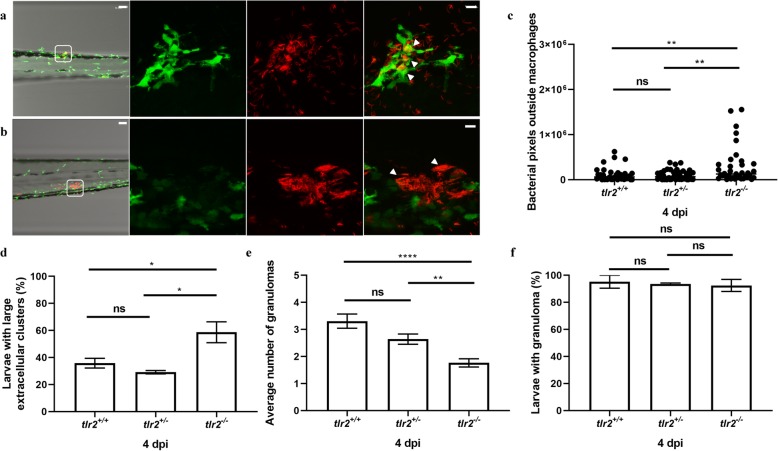
Quantification of Mma20 infection phenotype in the tlr2 mutant. Embryos were infected at 28 hpf with ~ 150 CFU M. marinum Mma20 strain. Confocal images of green fluorescent macrophages and red fluorescent bacteria in a granuloma of tlr2+/+Tg (mpeg1:EGFP) larva (a) and extracellular bacteria in tlr2−/−Tg (mpeg1:EGFP) larva (b) was conducted at 4 dpi with 10 (a, b, bright view images) and 63 (a, b, fluorescent view images) times magnification objectives. White arrowheads indicates a granuloma (a) and extracellular bacteria (b). In the bright view images of (a, b), the scale bar represents 50 μm. In the fluorescent view images of (a, b), the scale bar represents 10 μm. For quantification of bacteria outside macrophages by pixel count (c) large extracellular clusters of at least 8 μm diameter (d) and average number of granulomas in the CHT region (e) three groups of at least 37 embryos of tlr2+/+Tg (mpeg1:EGFP), tlr2+/−Tg (mpeg1:EGFP) and tlr2−/−Tg (mpeg1:EGFP) embryos were analysed at 4 dpi in the CHT region. For these CLSM analyses, 20 times magnification was used (Additional file 4: Figure S4 gives representative images). In panel f the percentage of embryos with at least one granuloma in the CHT region is shown. Statistical significance of differences was determined by one-way ANOVA with Tukey’s Multiple Comparison method as a post-hoc test for comparison between more than two groups (c-f). ns, non-significant; * P < 0.05; ** P < 0.01, **** P < 0.0001

Figure Data
Acknowledgments
This image is the copyrighted work of the attributed author or publisher, and ZFIN has permission only to display this image to its users. Additional permissions should be obtained from the applicable author or publisher of the image. Full text @ BMC Genomics