IMAGE

Fig. 2.

ID
ZDB-IMAGE-191230-481
Source
Figures for Chhabria et al., 2019
Image
Figure Caption

Fig. 2.

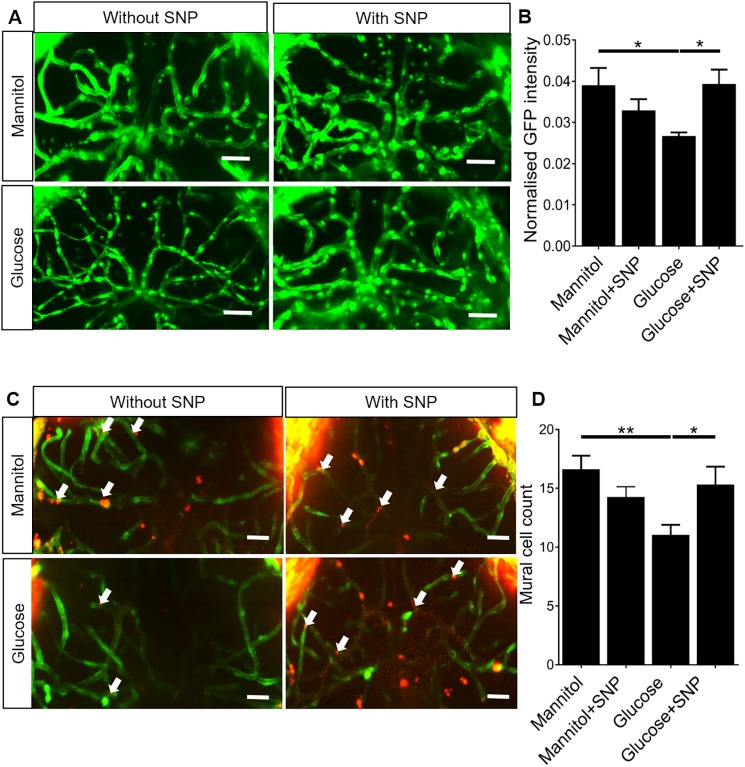
Effect of mannitol/glucose treatment with/withoutsodium nitroprusside(SNP)onklf2a:GFP expression and number of mural cellson thetectal vessels. (A) Representative micrographs of tectal vessels in Tg(klf2a:GFP) exposed to 20 mM mannitol or glucose co-treated with or without SNP. Scale bars: 20 µm. (B) Quantification of klf2a:GFP intensity in the tectal vessels (n=26 larvae/group). (C) Representative micrographs of tectal vessels showing separate and merged channels (green: fli1:GFF:UAS:GCaMP6; red: sm222ab:nls-mCherry sh480) for 20 mM mannitol- or glucose-exposed larvae co-treated with or without SNP. Scale bars: 20 µm. Arrows indicate mural cell nuclei. (D) Quantification of the number of sm22ab:nls-mCherrysh480 nuclei on the tectal vessels for 20 mM mannitol- or glucose-exposed larvae co-treated with or without SNP (n=28 larvae/group). Data are mean±s.e.m. *P<0.05, **P<0.01.

Acknowledgments
This image is the copyrighted work of the attributed author or publisher, and ZFIN has permission only to display this image to its users. Additional permissions should be obtained from the applicable author or publisher of the image. Full text @ Dis. Model. Mech.