IMAGE

Figure 1

ID
ZDB-IMAGE-191230-451
Source
Figures for Zwi et al., 2019
Image
Figure Caption

Figure 1

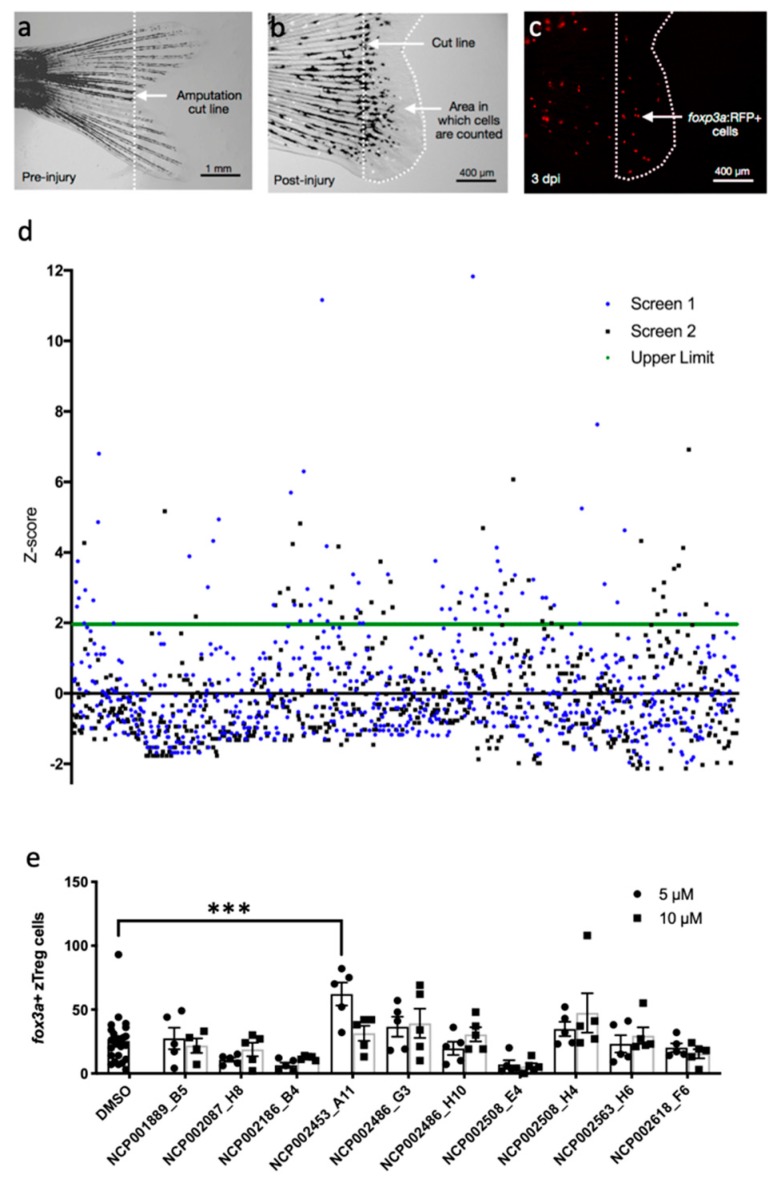
Chemical screen for modulators of zebrafish regulatory T cell (zTreg) recruitment in the regenerating tail. (a) Zebrafish tails were amputated at 4 weeks post-fertilization (wpf) along the dotted cut line. (b) Quantification was performed on the region from the amputation site to the tip of the regenerated tail at 3 days post-injury (dpi). (c) foxp3a: RFP+ zTreg cells were visualized by epifluorescence. (d) Normalized numbers of zTreg cells for each compound in the NIH Clinical Collection. Green line, statistical threshold for selecting compounds for retesting. (e) Screen hits were retested at 5 μM and 10 μM. Data presented as mean ± SEM; n = 5 per treatment group, n = 25 for controls. *** p < 0.001. None of the other treatments significantly increased the number of zTreg cells.

Acknowledgments
This image is the copyrighted work of the attributed author or publisher, and ZFIN has permission only to display this image to its users. Additional permissions should be obtained from the applicable author or publisher of the image. Full text @ Int. J. Mol. Sci.