
|
Figure 7
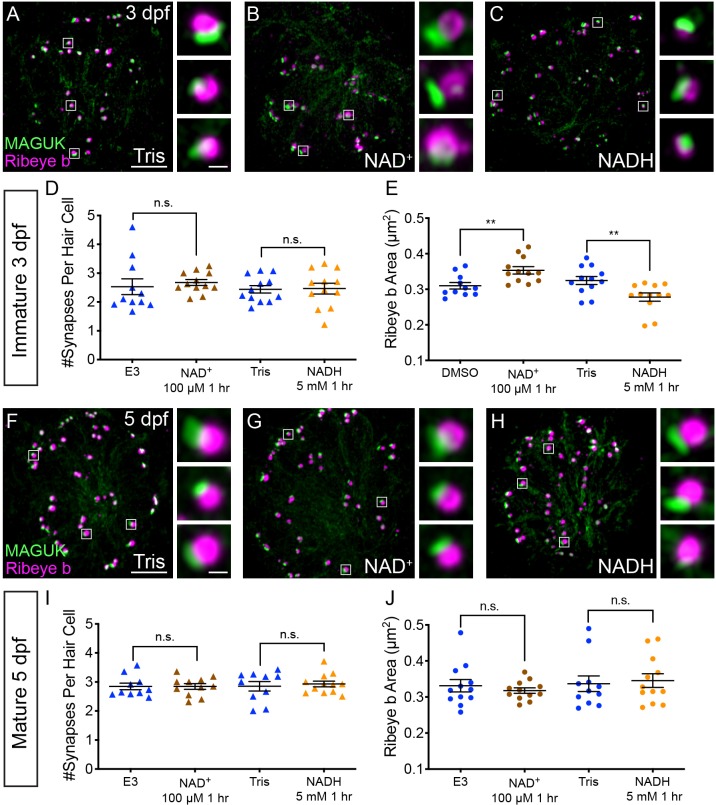
NAD+ and NADH directly influence ribbon formation.
Representative images of immature (A-C, 3 dpf) and mature (G-H, 5 dpf) neuromasts immunostained with Ribeye b (magenta, ribbons) and MAGUK (green, postsynapses) after a 0.1% Tris-HCl (A, F), 100 μM NAD+ (B, G) or 5 mM NADH treatment (C, H). Insets show three example synapses (white squares). D-E and I-J, Scatter plots show synapse count (D, I) and ribbon area (E, J) in controls and treatments groups. N ≥ 10 neuromasts per treatment. Error bars in B-C represent SEM. An unpaired t-test was used for comparisons in D and I and a Welch’s unequal variance t-test was used for comparisons in E and J, **p<0.01. Scale bar = 5 µm in A and F, 2 µm in insets.