
|
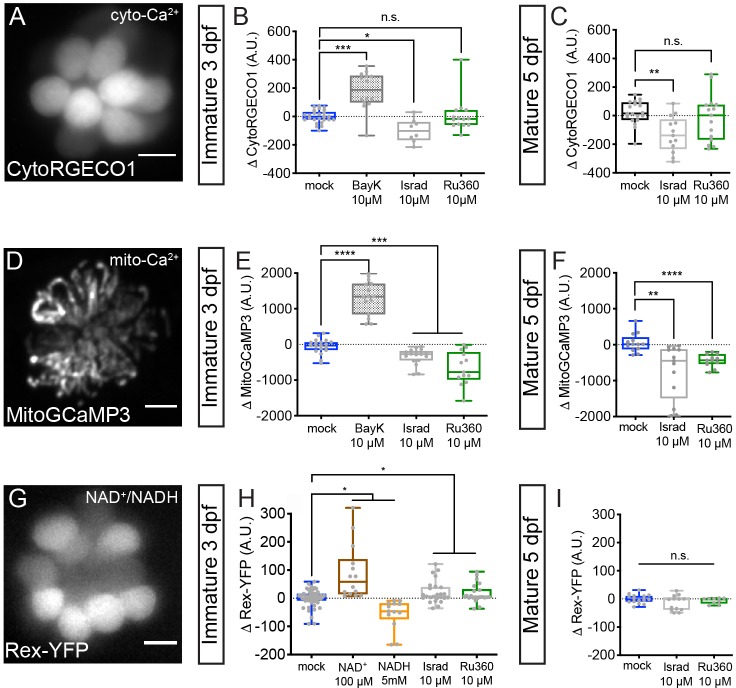
Figure 6
Cyto-Ca2+, mito-Ca2+ and NAD+/NADH redox baseline measurements.
Live hair cells expressing RGECO1 (A), MitoGCaMP3 (D), or Rex-YFP (G) show resting cyto-Ca2+, mito-Ca2+ or NAD+/NADH levels respectively. (B-C) RGECO1 baseline measurements before and after a 30 min mock treatment (0.1% DMSO) or after a 30 min 10 μM Bay K8644 (BayK), 10 μM isradipine, or 10 μM Ru360 treatment. (E-F) MitoGCaMP3 baseline measurements before and after a 30 min mock treatment (0.1% DMSO) or after a 10 μM BayK, 10 μM isradipine, or 10 μM Ru360 treatment. (H-I) Rex-YFP baseline measurements before and after 30 min mock treatment (0.1% DMSO) or after a 30 min 100 μM NAD+, 5 mM NADH, 10 μM isradipine, or 10 μM Ru360 treatment. All plots are box-and-whiskers plot that show median, min and max. N ≥ 9 neuromasts per treatment. A one-way Brown-Forsythe ANOVA with Dunnett’s T3 post hoc was used to calculate the difference in (B-C), (E-F), and a one-way Brown-Forsythe and Welch ANOVA with Holm-Sidak’s post hoc was used in H-I, *p<0.05, **p<0.01, ***p<0.001, ****p<0.0001. Horizontal lines in E, H, and I indicate that both conditions had similar p values compared to mock treatment. Scale bar = 5 μm in A, D and G.