
|
Figure 5
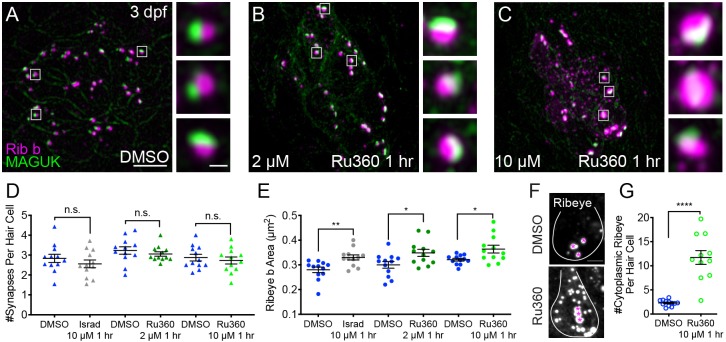
Mito-Ca2+ regulates ribbon formation.
(A-C) Representative images of immature neuromasts (3 dpf) immunostained with Ribeye b (magenta, ribbons) and MAGUK (green, postsynapses) after a 1 hr 0.1% DMSO (A), 2 μM Ru360 (B) or 10 µM Ru360 (C) treatment. Insets show three representative synapses (white squares) for each treatment. D-E, Scatter plot show quantification of synapse number (D), and ribbon area (E) in controls and in treatment groups. (F) Side-view of 2 hair cells (white outline) shows synaptic ribbon (three magenta asterisks in each cell) and extrasynaptic Ribeye b aggregates after a 1 hr 0.1% DMSO or 10 μM Ru360 treatment. (G) Quantification of extrasynaptic Ribeye puncta. N ≥ 12 neuromasts per treatment. Error bars in D-E and G represent SEM. An unpaired t-test was used in D and a Welch’s unequal variance t-test was used in E and G, *p<0.05, **p<0.01, ****p<0.0001. Scale bar = 5 µm in A, 2 µm in insets and F.