
|
Figure 1
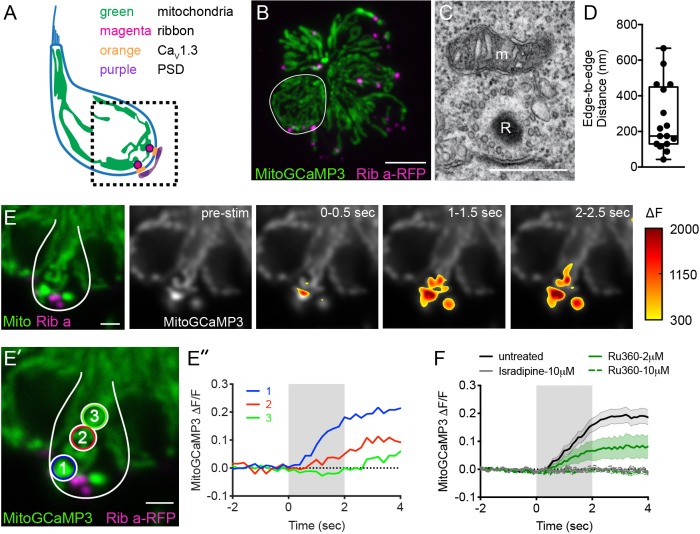
Mito-Ca2+ uptake initiates adjacent to ribbons.
(A) Cartoon illustration of a lateral-line hair cell containing: an apical mechanosensory bundle (blue), mitochondria (green), presynaptic ribbons (magenta), CaV1.3 channels (orange) and postsynaptic densities (purple). (B) Airyscan confocal image of 6 live hair cells (1 cell outlined in white) expressing MitoGCaMP3 (mitochondria) and Ribeye a-tagRFP (ribbons) in a developing neuromast at 2 dpf. Also see Figure 1—figure supplement 1. (C) A representative TEM showing a mitochondrion (m) in close proximity to a ribbon (R) at 4 dpf. (D) Quantification of mitochondrion to ribbon distance in TEM sections (n = 17 ribbons). (E) Side-view of a hair cell (outlined in white) shows the spatio-temporal dynamics of evoked mito-Ca2+ signals during a 2 s stimulation at 6 dpf. The change in MitoGCaMP3 signal (∆F) from baseline is indicated by the heatmap and are overlaid onto the pre-stimulus grayscale image. (E’-E’’) Circles 1–3 (1.3 μm diameter) denote regions used to generate the normalized (∆F/F0) temporal traces of mito-Ca2+ signals in E’’: adjacent to the presynapse (‘1’), and midbody (‘2’ and ‘3’) in the same cell as E. (F) Average evoked mito-Ca2+ response before (solid black) and after 30 min treatment with 10 μM Ru360 (dashed green), 2 μM Ru360 (solid green), or 10 μM isradipine (gray) (3–5 dpf, n ≥ 9 cells per treatment). Error bars in D are min and max; in F the shaded area denotes SEM. Scale bar = 500 nm in C, 5 µm in B and 2 µm in E and E’.