
Image
|
Figure Caption
Figure 1-S2
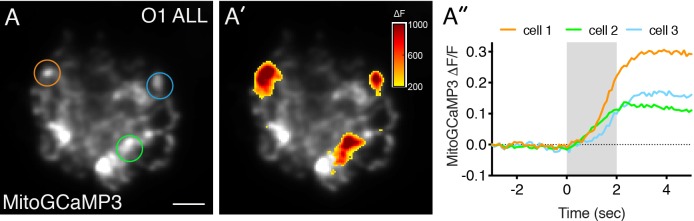
Mito-Ca2+ uptake occurs in anterior lateral-line hair cells.
(A) A live Image of an anterior-lateral line (ALL) neuromast viewed top-down, expressing the mito-Ca2+ sensor MitoGCaMP3 at 5 dpf. (A’) shows the spatio-temporal dynamics of evoked mito-Ca2+ signals during a 2 s stimulation. The MitoGCaMP3 signals during the stimulation (∆F) are indicated by the heatmap overlaid onto the baseline grayscale image. (A’’) Temporal traces of evoked mito-Ca2+ signals were generated from three regions denoted by three circles in A. Scale bar = 5 µm in A.
Acknowledgments
This image is the copyrighted work of the attributed author or publisher, and
ZFIN has permission only to display this image to its users.
Additional permissions should be obtained from the applicable author or publisher of the image.
Full text @ Elife