
|
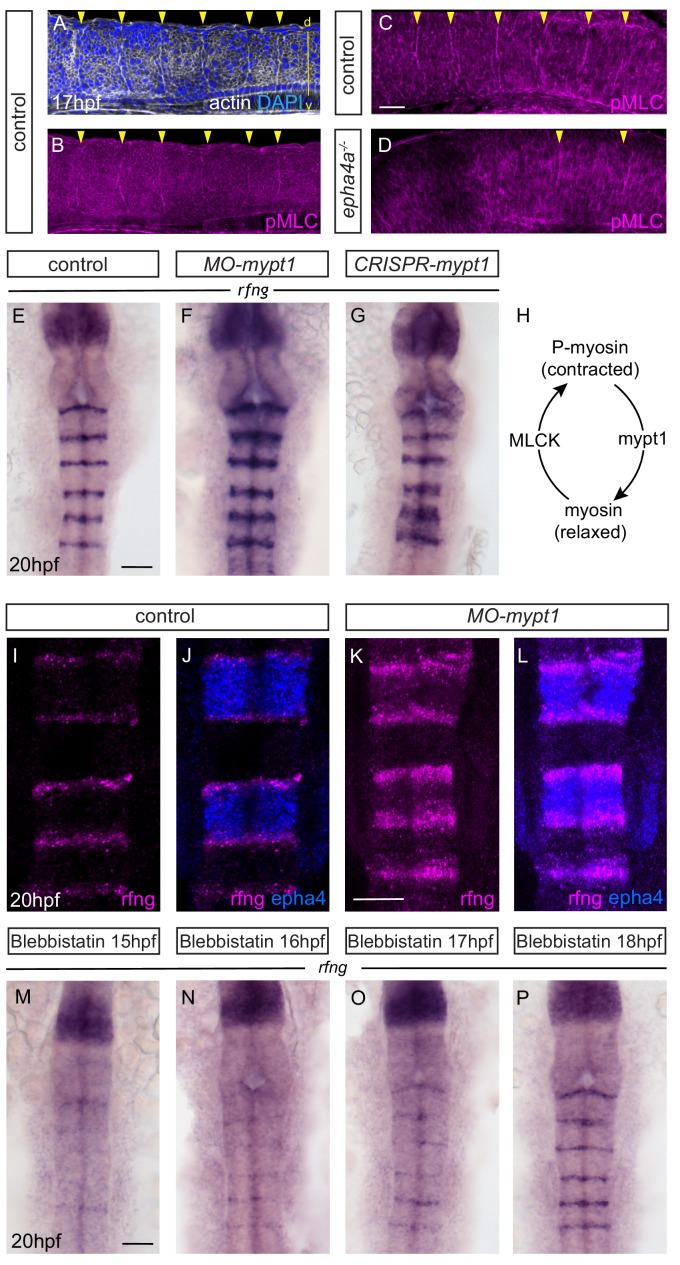
Figure 3 Actomyosin tension regulates boundary expression of rfng. (A, B) Immunostainings to detect actin (A) and pMLC (B) which co-localize at segment boundaries. (C, D) pMLC is detected at all boundaries in control embryos (C, 37/38) but not at r2/r3, r3/4 and r5/r6 boundaries in epha4-/- embryos (D, 24/24). Lateral views, anterior to the left. (E–G) rfng expression is increased in mypt1 knockdowns (F; 38/45) and embryos injected with CRISPR/Cas9 against mypt1 (G; 19/26), compared to controls (E; 37/38). (H) Depiction of Mypt1 regulating actomyosin tension by dephosphorylating pMLC. (I–L) HCR stainings reveal that rfng expression in epha4-expressing cells in control embryos (I, J; 24/24) is increased after knockdown of mypt1 (K, L; 28/36). (M–P) Myosin II inhibitor blebbistatin suppresses rfng transcription when treatment is initiated at 15 hpf (M; 21/21), 16 hpf (N; 25/25) or 17 hpf (O; 23/23), but it is less affected when initiated at 18 hpf (P; reduced in 8/22). (E–P) Dorsal views, anterior to the top. Scale bar: 50 μm.