Image
Figure Caption

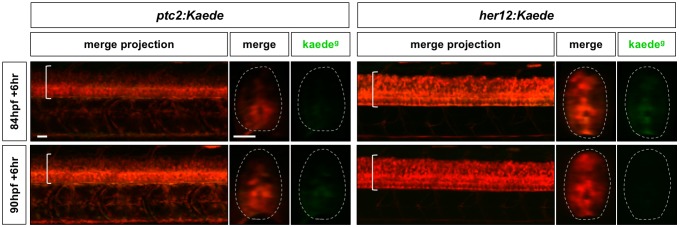
Figure 2—figure supplement 2. Notch and Hh response profiles after the ‘signalling termination’ phase.

Continuation of the time course described in Figure 2, where her12:Kaede and ptc2:Kaede embryos were photoconverted at 84 hpf or 90 hpf, and imaged 6 hr post-conversion. Lateral views of confocal projections and transverse views of single slices are shown. Kaedeg panels show de novo synthesised Kaedegreen after the time of photoconversion, while the merge panels show both previous Kaedered expression and new Kaedegreen expression. Brackets in lateral views and dotted lines in transverse views denote the extent of the spinal cord. n = 4 embryos per timepoint. Scale bars: 20 μm.

Acknowledgments
This image is the copyrighted work of the attributed author or publisher, and ZFIN has permission only to display this image to its users. Additional permissions should be obtained from the applicable author or publisher of the image. Full text @ Elife