
Image
|
Figure Caption
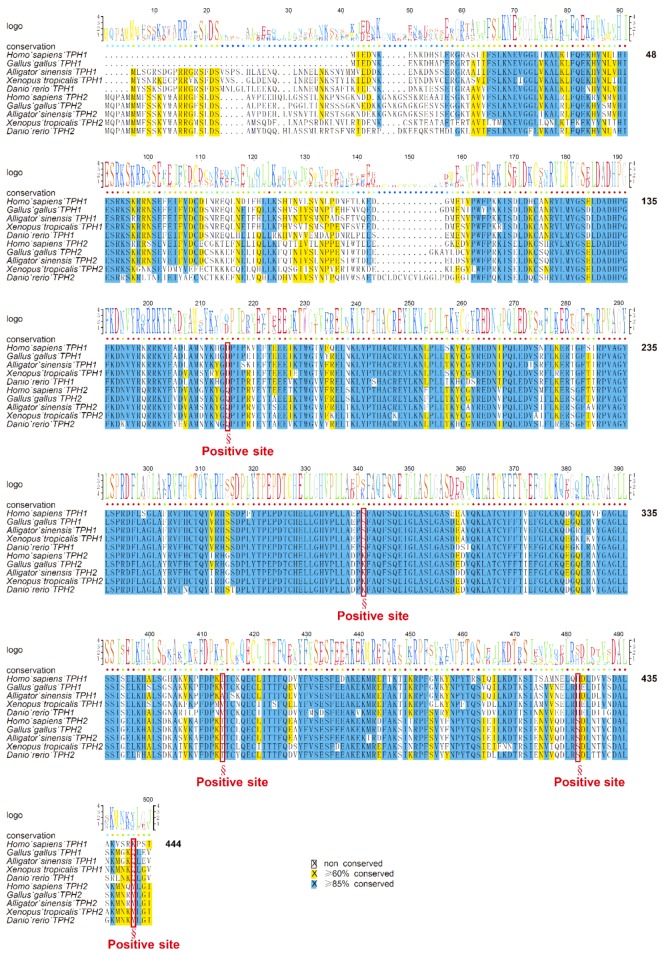
Figure 7
Alignment of the datasets for selection pressure analysis. The five positively selected sites predicted by the branch-site model test are marked with red boxes and emphasized with section marks (§).
Acknowledgments
This image is the copyrighted work of the attributed author or publisher, and
ZFIN has permission only to display this image to its users.
Additional permissions should be obtained from the applicable author or publisher of the image.
Full text @ Genes (Basel)