
|
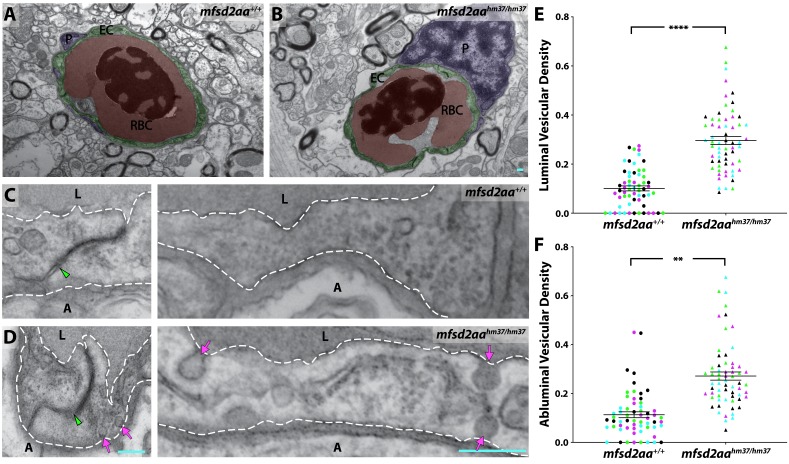
Figure 8 (A and B) TEM images of individual blood vessel cross-sections of adult wild-type (A) and mfsd2aa mutant fish (B). Endothelial cells (EC) are pseudo-colored green, pericytes (P) are pseudo-colored purple and red blood cells (RBC) are pseudo-colored red. (C and D) High-magnification images of endothelial cells outlined with white dashed lines of wild-type (C) and mfsd2aa mutants (D). The images are oriented with the lumen (L) on top and the ablumen (A) on the bottom. Mfsd2aa mutants appear to have normal tight junctions (green arrowhead) but elevated levels of luminal and abluminal vesicles (magenta arrows). The scale bars represent 200 nm. (E and F) Quantification of the vesicular densities both on the luminal (E) and abluminal (F) side of the endothelial cells reveals that mfsd2aa mutants have increased vesicular densities. N = 4 fish, each marked with a different color, with 15 blood vessels quantified for each fish and displayed as single points. ****p<0.0001, **p<0.01 by nested t test.