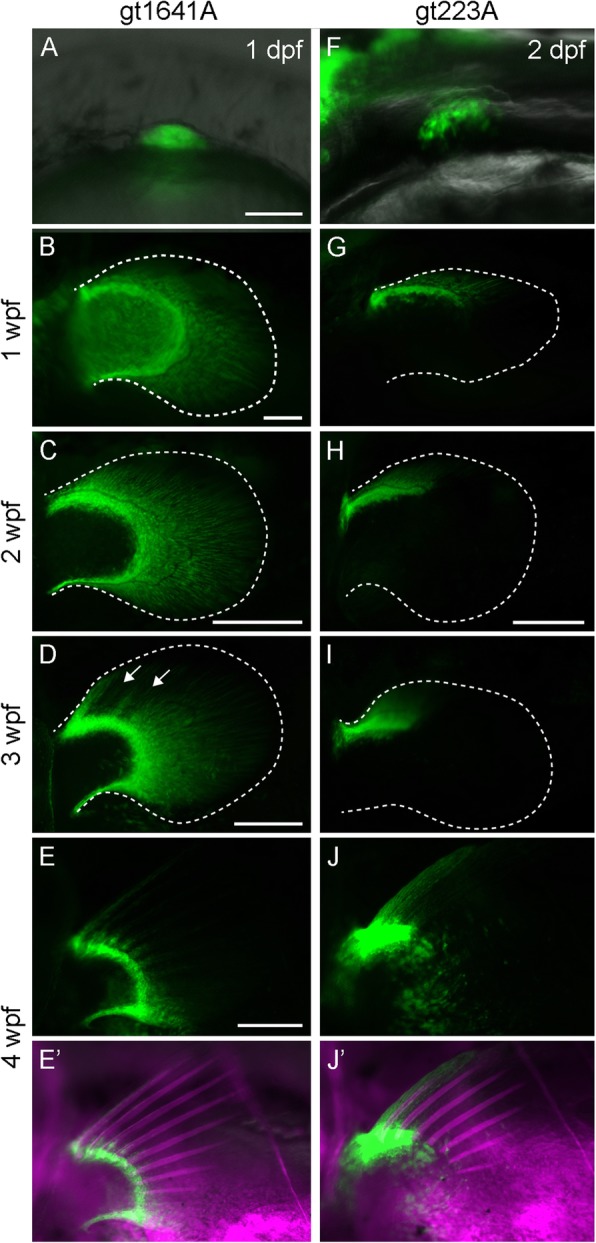
IMAGE

Fig. 5

ID
ZDB-IMAGE-191230-1492
Source
Figures for Hamada et al., 2019
Image
Figure Caption

Fig. 5

Expression pattern of EGFP in the pectoral fin of gt1641A and gt223A transgenic zebrafish. a-e’. Expression pattern of EGFP in the pectoral fin of a gt1641A transgenic fish observed at 1 dpf (a), 1 wpf (b), 2 wpf (c), 3 wpf (d), and 4 wpf (e, e’). f-j’. Expression pattern of EGFP in the pectoral fin of a gt223A transgenic fish observed at 2 dpf (f), 1 wpf (g), 2 wpf (h), 3 wpf (i), and 4 wpf (j, j’). White dashed lines indicate outline of the fin fold in the pectoral fin. Arrows in d indicate depletion of EGFP expression. Magenta in e’ and j’ indicate calcified bones stained by Alizarin Red. Scale bars in a and b and those in c, d, e, and h indicate 75 μm and 250 μm, respectively

Acknowledgments
This image is the copyrighted work of the attributed author or publisher, and ZFIN has permission only to display this image to its users. Additional permissions should be obtained from the applicable author or publisher of the image. Full text @ Zoological Lett