
|
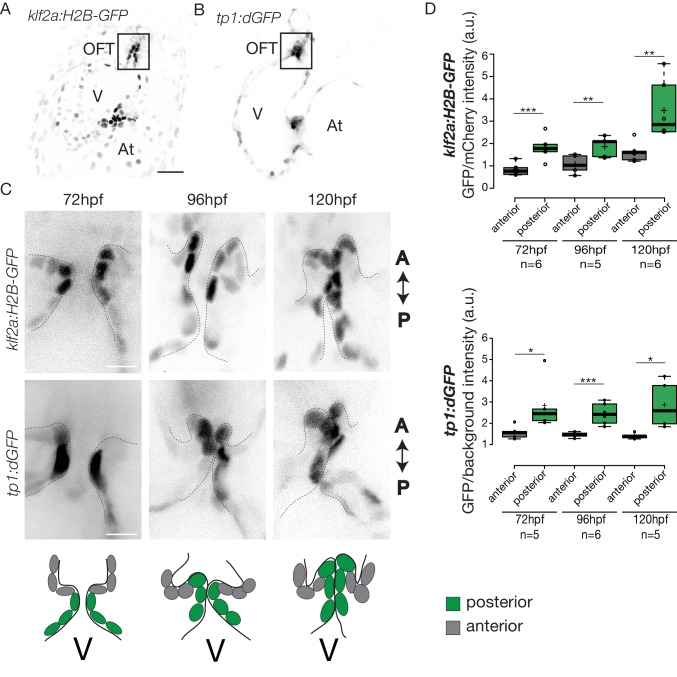
Figure 4 Klf2a and Notch reporters are activated in the OFT endothelium Confocal z-section of the Tg(klf2a:H2B-GFP; fli:nls-mCherry). (A) and Tg(tp1:dGFP) (B) at 72hpf. OFT: outflow tract, At: atrium, V: ventricle. Scale bar: 20 µm. (C) Confocal z-section of OFT valves expressing the Klf2a reporter and Notch reporter at 72 hpf, 96 hpf, and 120 hpf. Schemes explaining the considered anterior (grey) and posterior (green) parts of the valve at 72 hpf, 96 hpf, and 120 hpf. A: anterior, P: posterior. V: ventricle. Scale bar: 10 µm. (D) Quantification of the fluorescent intensity of the Klf2a (GFP over mCherry) and Notch (GFP over background) reporters in the anterior versus posterior part of the valves at 72 hpf (n = 6 embryos, p=0001 and n = 5 embryos, p=0,02 respectively), 96 hpf (n = 5 embryos, p=0005 and n = 6 embryos, p=0,0007 respectively) and 120 hpf (n = 6 embryos, p=0,01 and n = 5 embryos, p=0,01) in wild-type embryos using the student’s t-test. Boxplots: Center lines show the medians; box limits indicate the 25th and 75th percentiles as determined by R software; whiskers extend 1.5 times the interquartile range from the 25th and 75th percentiles, outliers are represented by dots. Results obtained from three independent experiments.