
|
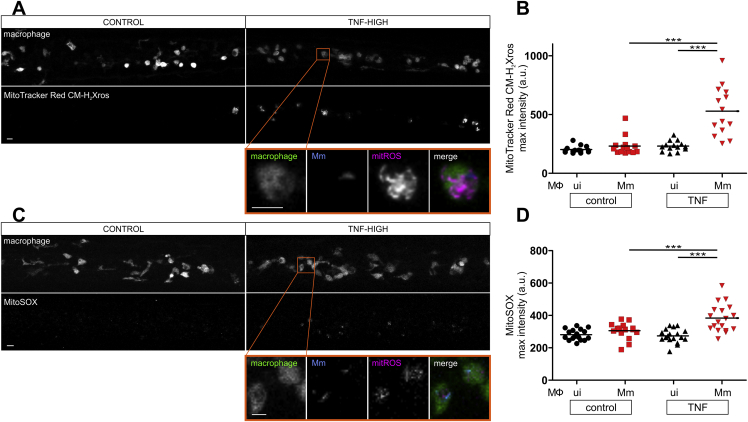
Figure S3
TNF Triggers Mitochondrial ROS Production Only in Infected Macrophages, Related to
(A) Representative confocal images of 1 dpi TNF-high or control larvae with yellow fluorescent macrophages, showing MitoTracker Red CM-H2Xros fluorescence corresponding to similar area of the fish as in
(B) Quantification of mitochondrial ROS production in 1 dpi TNF-high or control larvae. Each point represents the mean of maximum intensity fluorescence of MitoTracker Red CM-H2Xros per fish from images in (A). Black and red symbols represent uninfected and Mm-infected macrophages, respectively, in the same control or TNF-administered animal. Horizontal bars, means; ∗∗∗p < 0.001 (one-way ANOVA with Tukey’s post-test).
(C) Representative confocal images of 1 dpi TNF-high or control larvae showing MitoSOX fluorescence (red) corresponding to similar area of the fish as in
(D) Quantification of mitochondrial ROS production in 1 dpi TNF-high or control larvae. Each point represents the mean of maximum intensity fluorescence of MitoSOX per fish from images in (C). Black and red symbols represent uninfected and Mm-infected macrophages, respectively, in the same control or TNF-administered animal. Horizontal bars, means; ∗∗∗p < 0.001 (one-way ANOVA with Tukey’s post-test).
Reprinted from Cell, 178(6), Roca, F.J., Whitworth, L.J., Redmond, S., Jones, A.A., Ramakrishnan, L., TNF Induces Pathogenic Programmed Macrophage Necrosis in Tuberculosis through a Mitochondrial-Lysosomal-Endoplasmic Reticulum Circuit, 1344-1361.e11, Copyright (2019) with permission from Elsevier. Full text @ Cell