IMAGE

Figure 3

ID
ZDB-IMAGE-191230-124
Source
Figures for McDaniel et al., 2019
Image
Figure Caption

Figure 3

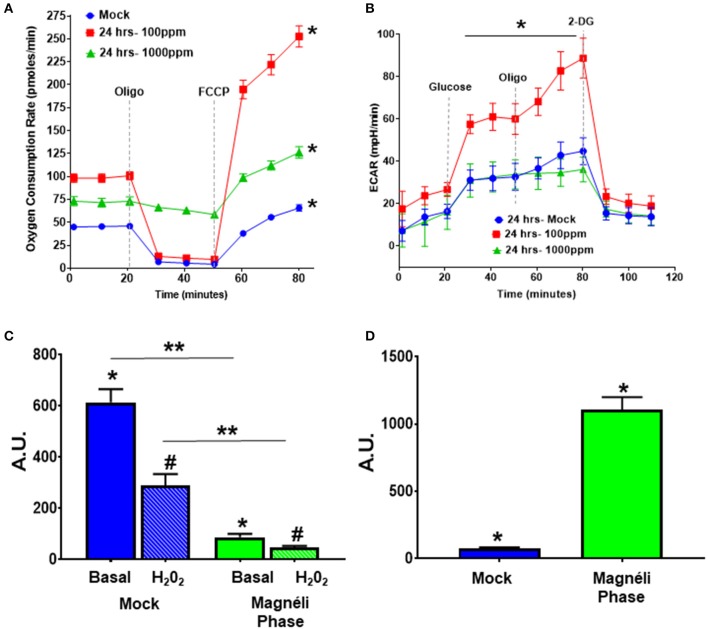
Alterations in cellular energetics and mitochondrial membrane potential in macrophages treated with Ti6O11. (A) Oxygen consumption rate (OCR) and (B) extracellular acidification rate (ECAR) were measured using Agilent Seahorse XF96 Analyzer in mock and Ti6O11 treated BMDMs at either 100 ppm or 1,000 ppm. (C) Mitochondrial membrane potential was evaluated using tetramethylrhodamine (TMRM) in macrophages treated with vehicle (blue) or 100 ppm Magnéli phases (green), with H2O2 used to induce maximum loss of membrane potential in each group. (D) Cellular oxidative stress was evaluated using dihydrodichlorofluorescein (DCF) fluorescence. All data are expressed as mean ± SEM (n = 3/group). AU, Arbitrary Units. *p < 0.05, #p < 0.05, **p < 0.01.

Acknowledgments
This image is the copyrighted work of the attributed author or publisher, and ZFIN has permission only to display this image to its users. Additional permissions should be obtained from the applicable author or publisher of the image. Full text @ Front Immunol