
|
Figure 7
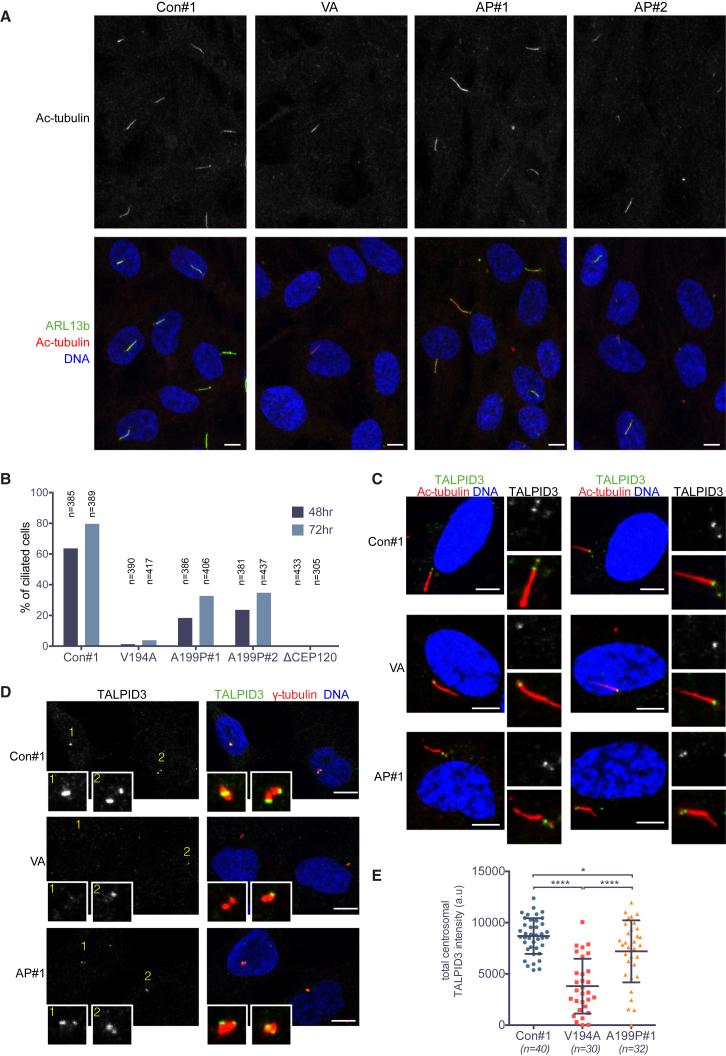
Ciliogenesis Is Markedly Reduced by the JS (V194A) and JATD (A199P) Mutations
(A) Cilia numbers are much reduced in V194A and A199P mutant RPE-1 cell lines. Serum-starved (48 hr) RPE-1 cells were stained by antibodies against the ciliary membrane protein ARL13b and acetylated α-tubulin. Images correspond to maximum intensity projections of confocal micrographs. Scale bars, 5 μm.
(B) Quantification of the experiment shown in (A). Number of cilia was counted in serum-starved (48 hr or 72 hr) A199P#1, A199P#2, V194A, and CEP120 null (ΔCEP120) RPE-1 cell clones.
(C) TALPID3 is detectable in the basal bodies of ciliated V194A, A199P, and control RPE-1 cell lines. Serum-starved (24 hr) RPE-1 cells were stained by antibodies against TALPID3 and acetylated-α-tubulin. Images to the right show basal bodies and cilia at high (2×) magnification. Images correspond to maximum intensity projections of confocal micrographs. Scale bars, 5 μm.
(D) TALPID3 localizes to the distal ends of mother and daughter centrioles in control and A199P mutant RPE-1 cell lines, but not in V194A cells. Serum-starved (24 hr) RPE-1 cells were stained by antibodies against TALPID3 and γ-tubulin. Insets show centrosomes at high (4×) magnification. Numbering is included to aid identification of centrosomes. Images correspond to maximum intensity projections of confocal micrographs. Scale bars, 5 μm.
(E) Centrosomal TALPID3 levels are reduced in V194A mutant RPE-1 cell lines. Quantification of total centrosomal TALPID3 levels from maximum intensity projections obtained in experiment shown in (D). Quantification was performed as in
See also