
|
Figure 6
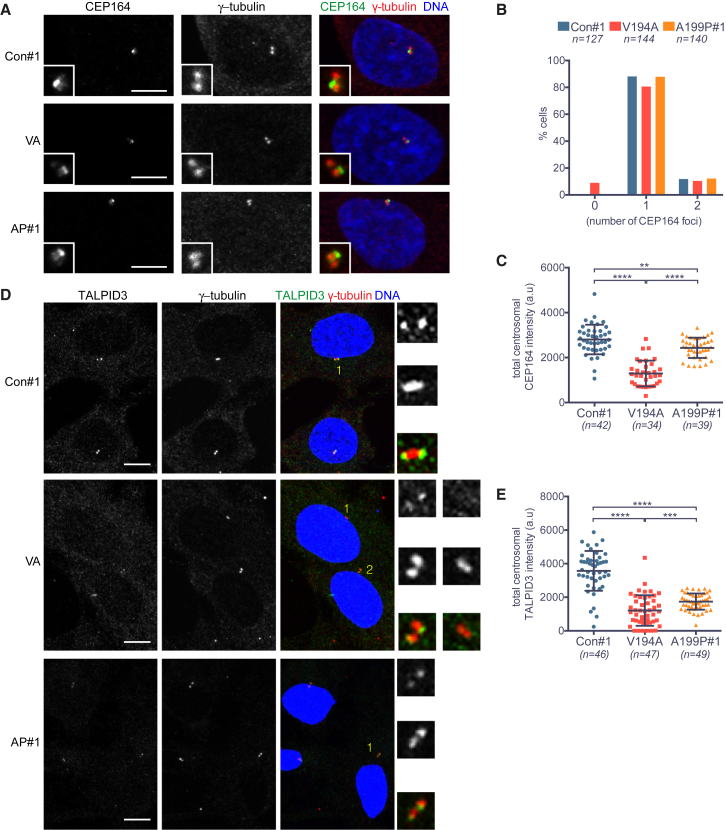
Impaired Recruitment of Centriole Distal End Proteins in JS (V194A) and JATD (A199P) Mutant RPE-1 Cells
(A) CEP164 localizes to the distal end of the mother centriole in control, V194A, and A199P mutant RPE-1 cell lines. Cells were stained by antibodies against CEP164 and γ-tubulin. Images correspond to maximum intensity projections of confocal micrographs. Insets depict high (3×) magnification of centrosomes. Scale bars, 5 μm.
(B) The number of CEP164 foci is reduced in V194A cells. Asynchronous (non-mitotic) cells are expected to have a single CEP164 focus from G1 through S phase, followed by the appearance of two foci in G2.
(C) Centrosomal CEP164 levels are reduced in both V194A and A199P mutant cell lines. Quantification of total centrosomal CEP164 levels from maximum intensity projections obtained in the experiment shown in (A). Quantification was performed as in
(D) TALPID3 localizes to the distal ends of mother and daughter centrioles in control, V194A, and A199P mutant RPE-1 cell lines. Cells stained by antibodies against TALPID3 and γ-tubulin. Images correspond to maximum intensity projections of confocal micrographs. Insets show numbered centrosomes at high (4×) magnification. Scale bars, 5 μm.
(E) Centrosomal TALPID3 levels are reduced in both V194A and A199P mutant RPE-1 cell lines. Quantification of total centrosomal TALPID3 levels from maximum intensity projections obtained in the experiment shown in (D). Quantification was performed as in
See also