
|
Figure 4
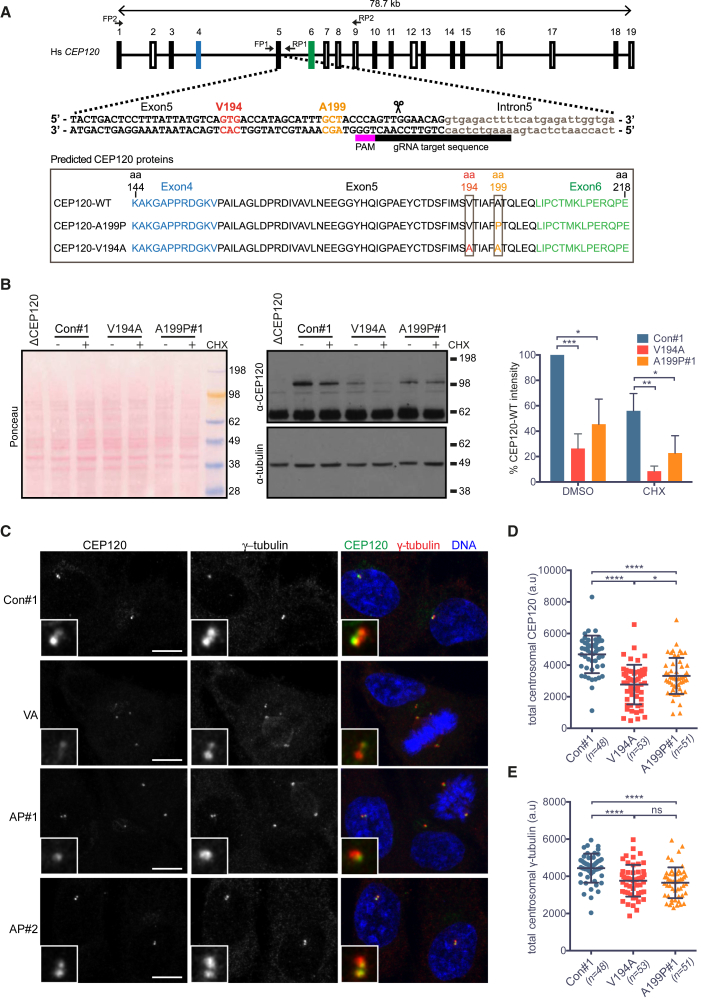
Characterization of RPE-1 Cell Lines Homozygous for the JS (V194A) and JATD (A199P) Mutations in CEP120
(A) Gene structure of human CEP120 with indicated guide RNA used to introduce the V194A or the A199P mutation into this locus. Primers FP1 and RP1 were used to amplify and sequence the targeted genomic region. The framed area depicts protein products corresponding to the sequences obtained from the mutant RPE-1 clones. See
(B) The V194A and A199P mutations decrease steady-state levels of CEP120
(C) In V194A and A199P mutant RPE-1 cells, the asymmetric localization pattern of CEP120 is retained, but its overall centrosomal levels are lower than those in control cells. Control (con#1), V194A (VA), and A199P (AP#1) RPE-1 cells stained by antibodies against CEP120 and the PCM protein (γ-tubulin). Images correspond to maximum intensity projections of confocal micrographs. Insets depict high (5×) magnifications of selected centrosomes. Scale bars, 5 μm.
(D) Quantification of total centrosomal CEP120 levels from maximum intensity projections obtained in the experiment shown in (C). Total CEP120 fluorescence signal was measured in each cell within a 1.5-μm-diameter circle encompassing the centrosome, followed by subtraction of the corresponding background signal. Swarm plot represents values from single cells with horizontal lines marking the median, and error bars represent SD. p values were obtained from an unpaired, two-tailed Student’s t test (∗p < 0.05, ∗∗∗∗p < 0.0001). Similar results were obtained from three independent experiments.
(E) Quantification of total centrosomal γ-tubulin levels from maximum intensity projections obtained in experiment shown in (C). Quantification was performed as in (D). Swarm plot represents values from single cells with horizontal lines marking the median, and error bars represent SD. p values were obtained from a two-tailed Mann-Whitney
See also