IMAGE

Fig 5

ID
ZDB-IMAGE-191230-1163
Genes
Source
Figures for Watterston et al., 2019
Image
Figure Caption

Fig 5 Loss of <italic>miR26a</italic> morphants leads to increased expression of vSMC genes and <italic>acta2</italic>-positive vSMCs.

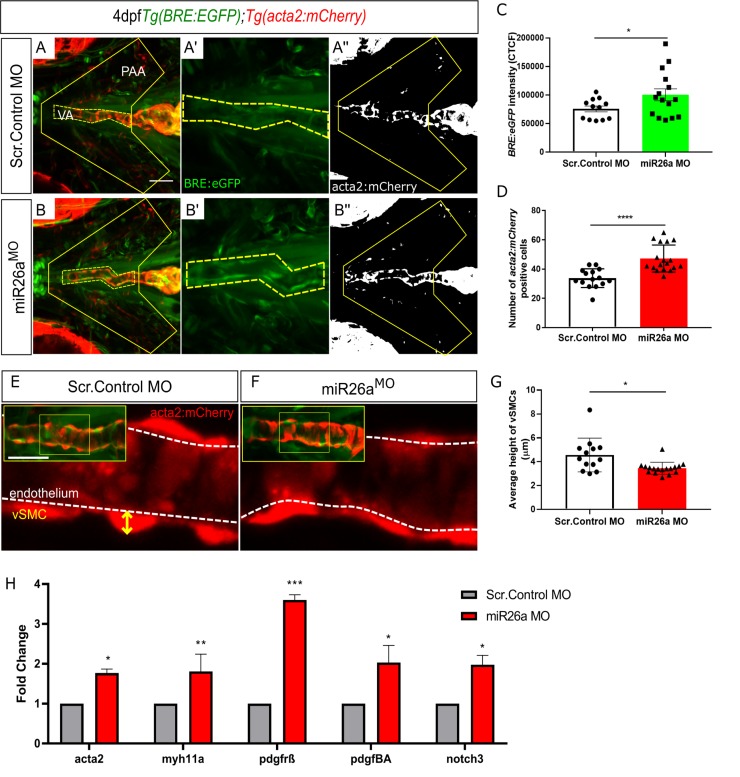
A-B) Representative ventral views of 4 dpf Tg(BRE:EGFP); Tg(acta2:mCherry) embryos. Scr. Control embryos (A-A”) and miR26a morphant embryos (B-B”) showing qualitative upregulation of BRE:EGFP in the ventral aorta (VA) and pharyngeal arch arteries (PAA). C) Quantification of green fluorescent marker (BRE:EGFP) along the VA, taken from the highlighted yellow region in A’ and B’, and represented as corrected total cell fluorescence (CTCF) (N = 3, miR26a MO n = 15, Scr. Control n = 12, Unpaired t test, ****p< 0.0001 as compared to control, error bars = SEM). D) Quantification of acta2 positive cell number on VA and PAAs, within area outlined in A” and B”. Number of acta2 positive cells is significantly increased in miR26a morphants (N = 3, miR26a MO n = 18, Scr. Control n = 15, Unpaired t test, ****p< 0.0001 as compared to control, error bars = SEM). E and F) Measurement of vSMC height (yellow axis) from the endothelium (white dashed line). Representative images of ventral aorta (from insets), Scr. Control (E) and miR26a morphants (F). G) Quantification of average vessel heights along the length of the VA (N = 3, miR26a MO n = 18, Scr. Control n = 13, Student's two-tailed t-test, ****p< 0.0001 as compared to control, error bars = SEM). H) RT-qPCR quantification of vSMC differentiation genes in injected controls and miR26a morphants (n = 3). RT-qPCR data show the mean ± SEM, Student's two-tailed t-test *p < 0.05, n, number of biological replicates.

Figure Data
Acknowledgments
This image is the copyrighted work of the attributed author or publisher, and ZFIN has permission only to display this image to its users. Additional permissions should be obtained from the applicable author or publisher of the image. Full text @ PLoS Genet.