IMAGE

Fig 3

ID
ZDB-IMAGE-191230-1160
Source
Figures for Watterston et al., 2019
Image
Figure Caption

Fig 3 <italic>miR26a</italic> knockdown embryos have increased endothelial pSmad1.

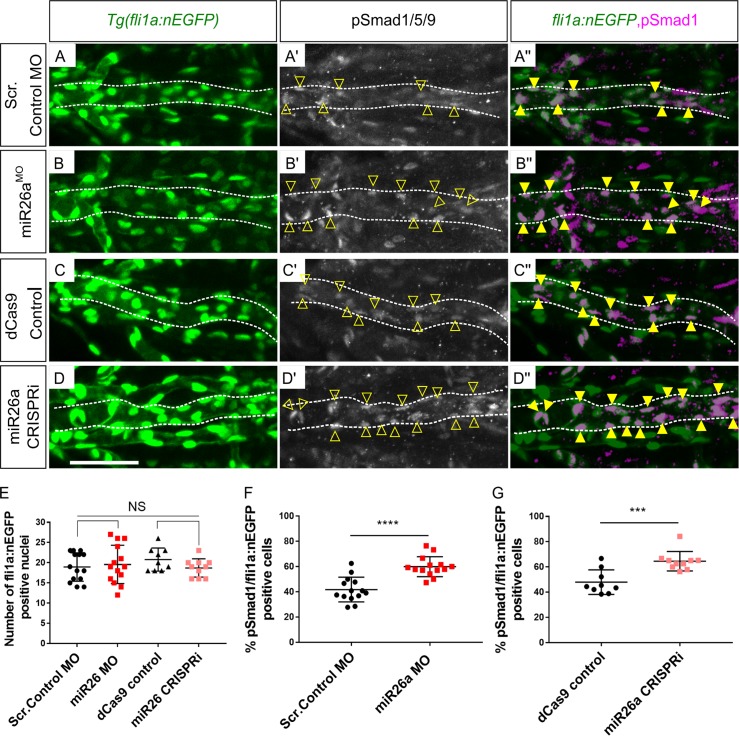
A-D) Ventral view confocal projections of the 4 dpf ventral aorta (dotted outline). Endothelial nuclei (fli1a:nEGFP; A-D, arrowheads) and pSmad1/5/9 (pSmad1,white A’- D’) and overlay (magenta, A”- D”) in 4 dpf Scr. Control (A), miR26a MO (B), dCas9 control (C) and miR26a CRISPRi (D) embryos. Yellow arrowheads indicate double positive pSmad1 + fli1a:nEGFP nuclei in the ventral aorta. E) Quantification of total number of fli1a:nEGFP nuclei in the ventral aorta. F-G) Quantification of the percentage of double pSmad1; fli1a:nEGFP positive nuclei in miR26a morphants (F) and miR26a CRISPRi (G) embryos. N = 3 experiments. Total embryos are as follows: Scr. Control MO n = 14, miR26a MO n = 14, dCas9 control n = 9 and miR26a CRISPRi n = 10. Student's two-tailed t-test, p***< 0.0001 and p ****< 0.00001 as compared to WT, error bars = SD. Scale bar: represents 50μm.

Acknowledgments
This image is the copyrighted work of the attributed author or publisher, and ZFIN has permission only to display this image to its users. Additional permissions should be obtained from the applicable author or publisher of the image. Full text @ PLoS Genet.