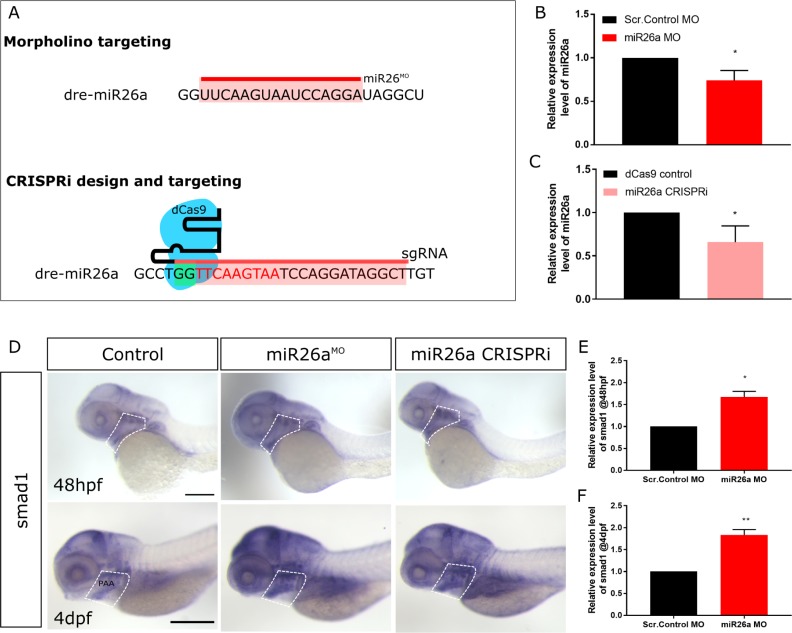
IMAGE

Fig 2

ID
ZDB-IMAGE-191230-1159
Genes
Source
Figures for Watterston et al., 2019
Image
Figure Caption

Fig 2 <italic>miR26a</italic> knockdown increases <italic>smad1</italic> expression.

A) Schematic of miR26a transient knockdown methods. B and C) Relative expression level of miR26a in morpholino and CRISPRi injected embryos at 48 hpf (n = 3). D) Whole mount in situ hybridization staining for smad1 at 48 hpf and 4 dpf shows increased expression of smad1 in miR26a knockdown embryos particularly in the ventral aorta, aortic arches and pharyngeal region (dotted outline). Scale bar represents 200μm. E) Relative expression of smad1 in 48 hpf morphants is increased compared to control embryos (n = 3). F) Relative expression of smad1 in 4 dpf miR26a morphants is increased compared to control embryos (n = 4). RT-qPCR data show the mean ± SEM, Student's two-tailed t-test *p < 0.05, n = number of biological replicates.

Figure Data
Acknowledgments
This image is the copyrighted work of the attributed author or publisher, and ZFIN has permission only to display this image to its users. Additional permissions should be obtained from the applicable author or publisher of the image. Full text @ PLoS Genet.