IMAGE

FIGURE 5

ID
ZDB-IMAGE-191230-1153
Source
Figures for Huang et al., 2019
Image
Figure Caption

FIGURE 5

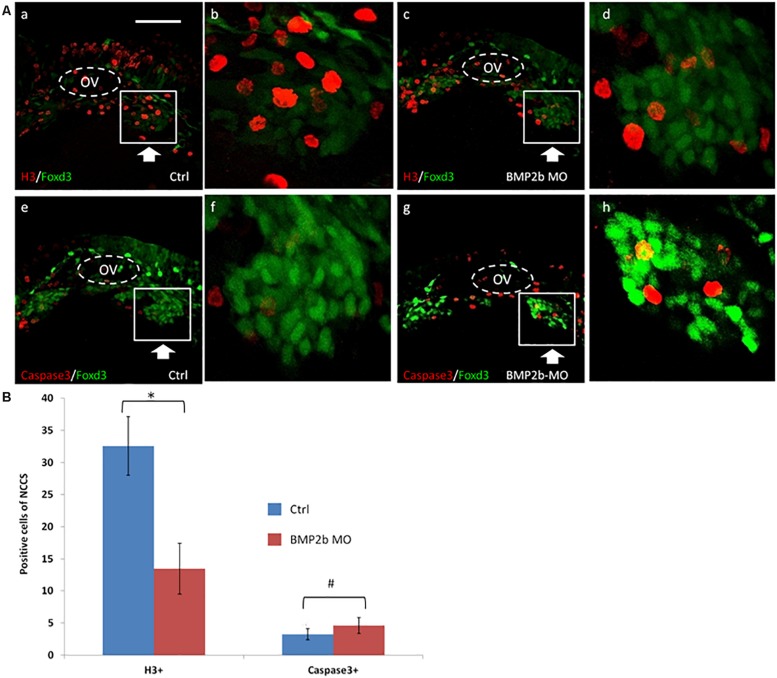
Proliferation but not apoptosis was changed in vagal NCC and ENS NCC in BMP2b morphants. Here we selected the areas included in the squares to count the positive cells, and the square areas were magnified on the right side of each image. (A,b,f) Lateral views of the vagal region of 30 hpf wild type(11/11, 100%)and (A,d,h) BMP2b MO treated (29/33, 87.9%)Foxd3:GFP transgenic embryos. Embryos were double stained with anti gfp (green) to study the distribution of vagal NCC and ENS NCC’s, anti caspase 3 (red) (A,e,h) to confirm apoptotic cells and, anti phosphohistone H3 (red) (A,a,d) to reveal proliferating cells. OV means otic vesicle. Large arrowheads pointed to the stream of vagal NCC. White boxes include the region that is shown in close up in the insert. Small white arrowheads point to the proliferating cells. (B) The NCC proliferation in the ctrl group is approximately 2.3 fold the H3+ cells of BMP2b MO group. The NCC apoptosis in the ctrl group is approximately 0.87 fold the Caspase3+ cells of BMP2b MO group. Values are given as mean ± SE. n = 6, t-test, P < 0.05, compared with BMP2b MO group; #P > 0.05, compared with BMP2b MO group. Bar, 100 μm.

Figure Data
Acknowledgments
This image is the copyrighted work of the attributed author or publisher, and ZFIN has permission only to display this image to its users. Additional permissions should be obtained from the applicable author or publisher of the image. Full text @ Front. Cell. Neurosci.