IMAGE

Fig 3

ID
ZDB-IMAGE-191230-1090
Source
Figures for Marquart et al., 2019
Image
Figure Caption

Fig 3 Optogenetic prepontine neuron stimulation elicits C-start behavior.

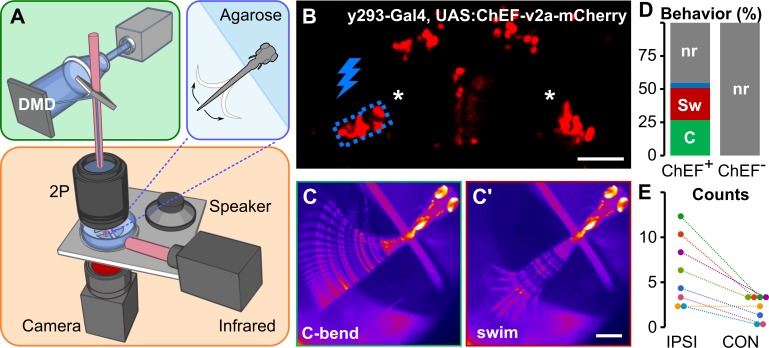
(A) Schematic of optogenetic stimulation and two-photon calcium imaging: a DMD was used to spatially restrict 460-nm LED excitation (green box) within the brain of head-embedded larvae (blue box) mounted on a stage with a speaker for acoustic/vibratory stimulation, an infrared light source for tail illumination, and a high-speed camera for behavioral readout (orange box). (B) Two-photon optical section of mCherry expression in y293-Gal4, UAS:ChEF-2a-mCherry larva with the area around one prepontine cluster (asterisks) stimulated by the DMD outlined in blue. Scale bar 40 μm. (C) C-start and swim-like (C') behaviors elicited by unilateral optogenetic stimulation of prepontine neurons in y293-Gal4, UAS:ChEF-positive larvae. Scale bars 500 μm. (D) Percent of behaviors elicited by illumination of larvae expressing ChEF (ChEF+; 229 trials, n = 8 larvae) and nonexpressing sibling controls (ChEF; 63 trials, n = 7 larvae). C-start-like responses (“C,” green), swim-like bouts (“Sw,” red), other responses (blue), nr (gray). (E) Number of C-start responses made ipsilateral (“IPSI”) and contralateral (“CON”) to the side of optogenetic stimulation, color-coded for each of the 8 larvae tested. χ2 = 15.25, *p < 0.001. Underlying numerical data are included in S1 Data. DMD, digital mirror device; LED, light-emitting diode; mCherry, monomeric Cherry; nr, no response.

Acknowledgments
This image is the copyrighted work of the attributed author or publisher, and ZFIN has permission only to display this image to its users. Additional permissions should be obtained from the applicable author or publisher of the image. Full text @ PLoS Biol.