IMAGE

Fig 2

ID
ZDB-IMAGE-191230-1089
Source
Figures for Marquart et al., 2019
Image
Figure Caption

Fig 2 A cluster of neurons in the prepontine hindbrain initiates delayed escapes.

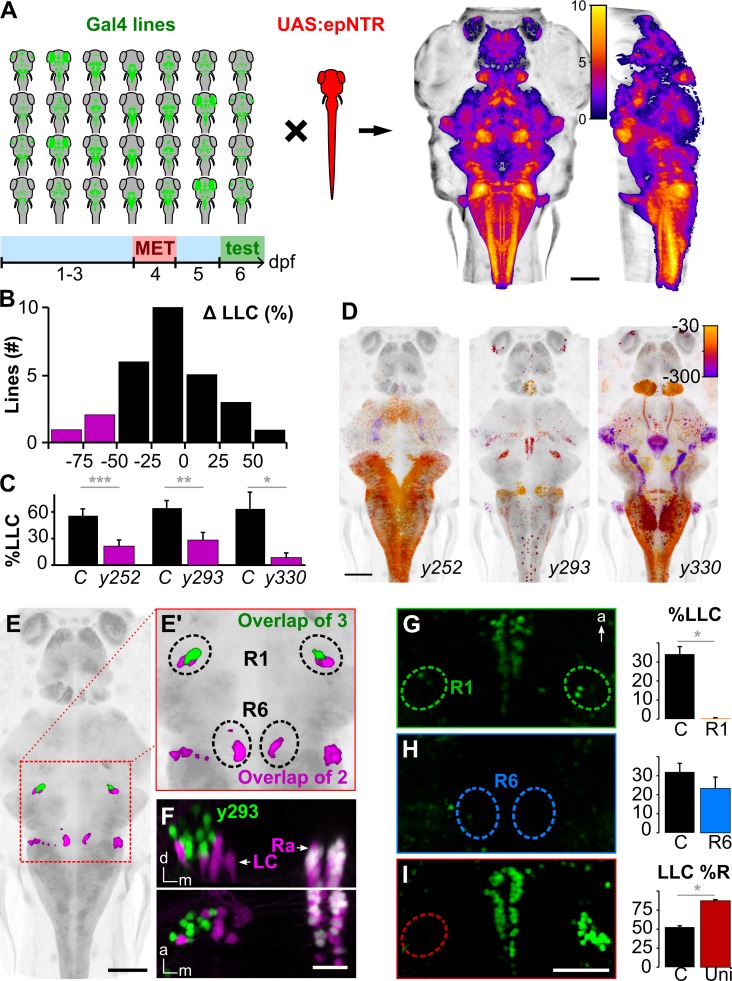
(A) Schematic of circuit-breaking screen: 28 Gal4 enhancer trap lines were crossed to UAS:epNTR, and labeled neurons were ablated and tested for escape behavior. Right: heat maps representing maximum horizontal and sagittal projections of brain coverage (number of lines labeling a given voxel). (B) Histogram of the change in LLC probability following ablation (compared to MET-treated non-epNTR-expressing sibling controls) for each line screened. Magenta: Gal4 lines with a >50% reduction. A minimum of 7 larvae were used per condition per line. %LLC is the percentage of trials on which an LLC was performed as a fraction of trials with no SLC response. (C) LLC probability for lines highlighted in (B). LLC probability after ablation (magenta) and in MET-treated sibling controls (black). y252-Gal4 (n = 22 control, 31 ablated larvae), y293-Gal4 (n = 17, 17), y330-Gal4 (n = 8, 7). ***p < 0.001, **p < 0.01, *p < 0.05, t test. (D) Maximum horizontal projections for Gal4 lines with reduced LLC probability after ablation. Expression is color-coded for depth (μm below image top). (E) Expression overlap between y252-Gal4 and y293-Gal4 (magenta) and between all 3 lines (green). Boxed area enlarged in (E'). (F) Coronal (top) and dorsal (bottom) projections of confocal substacks through the R1 cluster in y293-Gal4; UAS:Kaede (green); vmat2:GFPpku2 (magenta) larvae. Prior to imaging, Kaede was photoconverted to red. Arrows indicate LC and Ra labeled by vmat2:GFP. Both Kaede and GFP are expressed in the raphe (white). (G-H) LLC probability after laser ablation of R1 (G, n = 9) and R6 (H, n = 16) in y293-Gal4. *p < 0.05, t test. (I) Percent of LLCs made in a rightward direction after left R1 ablation (“Uni,” n = 14) and nonablated controls (n = 24). *p < 0.05, t test. Scale bars: 100 μm in (A, D, E); 25 μm in (F); 40 μm in (G-I). Underlying numerical data are included in S1 Data, and unprocessed image stacks in (F) are available at https://doi.org/10.5281/zenodo.3382102. a, anterior; d, dorsal; dpf, day post-fertilization; epNTR, engineered nitroreductase variant; GFP, green fluorescence protein; LC, locus coeruleus; LLC, long-latency C-start; m, medial; MET, metronidazole; R1, rhombomere 1; Ra, raphe; SLC, short-latency C-start.

Acknowledgments
This image is the copyrighted work of the attributed author or publisher, and ZFIN has permission only to display this image to its users. Additional permissions should be obtained from the applicable author or publisher of the image. Full text @ PLoS Biol.