IMAGE

Fig. 3

ID
ZDB-IMAGE-191220-6
Genes
Source
Figures for Yang et al., 2019
Image
Figure Caption

Fig. 3

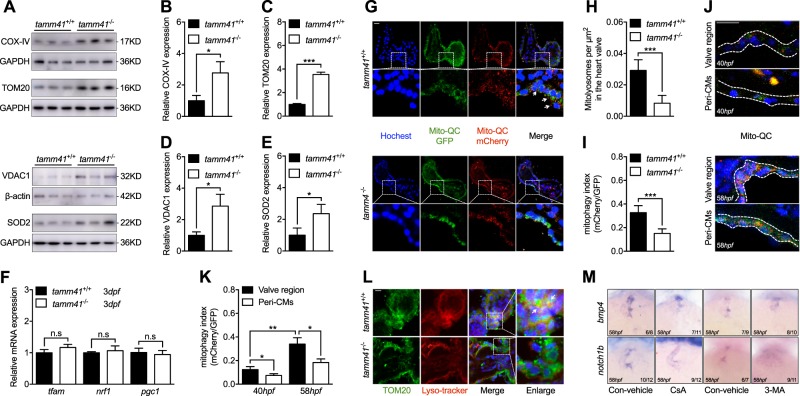
Disturbed mitophagy progression tamm41 deficient embryos. aeTamm41−/− embryos exhibit increased IMM (COX-IV), OMM (VDAC1, TOM20), and matrix (SOD2) protein levels revealed via western blot analysis. f Normally expressed mitochondrial biogenesis genes (tfam, nrf1, pgc1) in tamm41−/− embryos revealed by qPCR. gi The mito-QC was used to detect the lysosome-located mitochondria in tamm41+/+ and tamm41−/− hearts. Reduced red fluorescence intensity in tamm41−/− heart valve, which is not observed in the circulating red blood cells. For each group, ten hearts were examined. Scale bar: 20 μm. j, k mito-QC examination of mitophagy activities at 40 hpf and 58 hpf hearts. For each heart (n = 10), a ratio of mCherry to GFP mean fluorescence intensity was generated for the valve or peri-cardiomyocytes (Peri-CMs) region. Scale bar: 20 μm. l Representative images manifest the increased delivery of mitochondria (TOM20, green) to lysosome (lyso-tracker, red) in tamm41+/+ hearts (shown by white arrows), as compared with that in tamm41−/− hearts. For each group, ten hearts were examined. Scale bar: 20 μm. m Reduced heart valve genes, including bmp4 and notch1b, caused by either CsA or 3-MA addition. Black horizontal lines indicate mean ± SD. Means ± SD are shown for three independent experiments. n.s, not significant, *P < 0.05; **P < 0.01; ***P < 0.001 (Student’s t-test)

Figure Data
Acknowledgments
This image is the copyrighted work of the attributed author or publisher, and ZFIN has permission only to display this image to its users. Additional permissions should be obtained from the applicable author or publisher of the image. Full text @ Cell Death Differ.