
|
Fig. 1
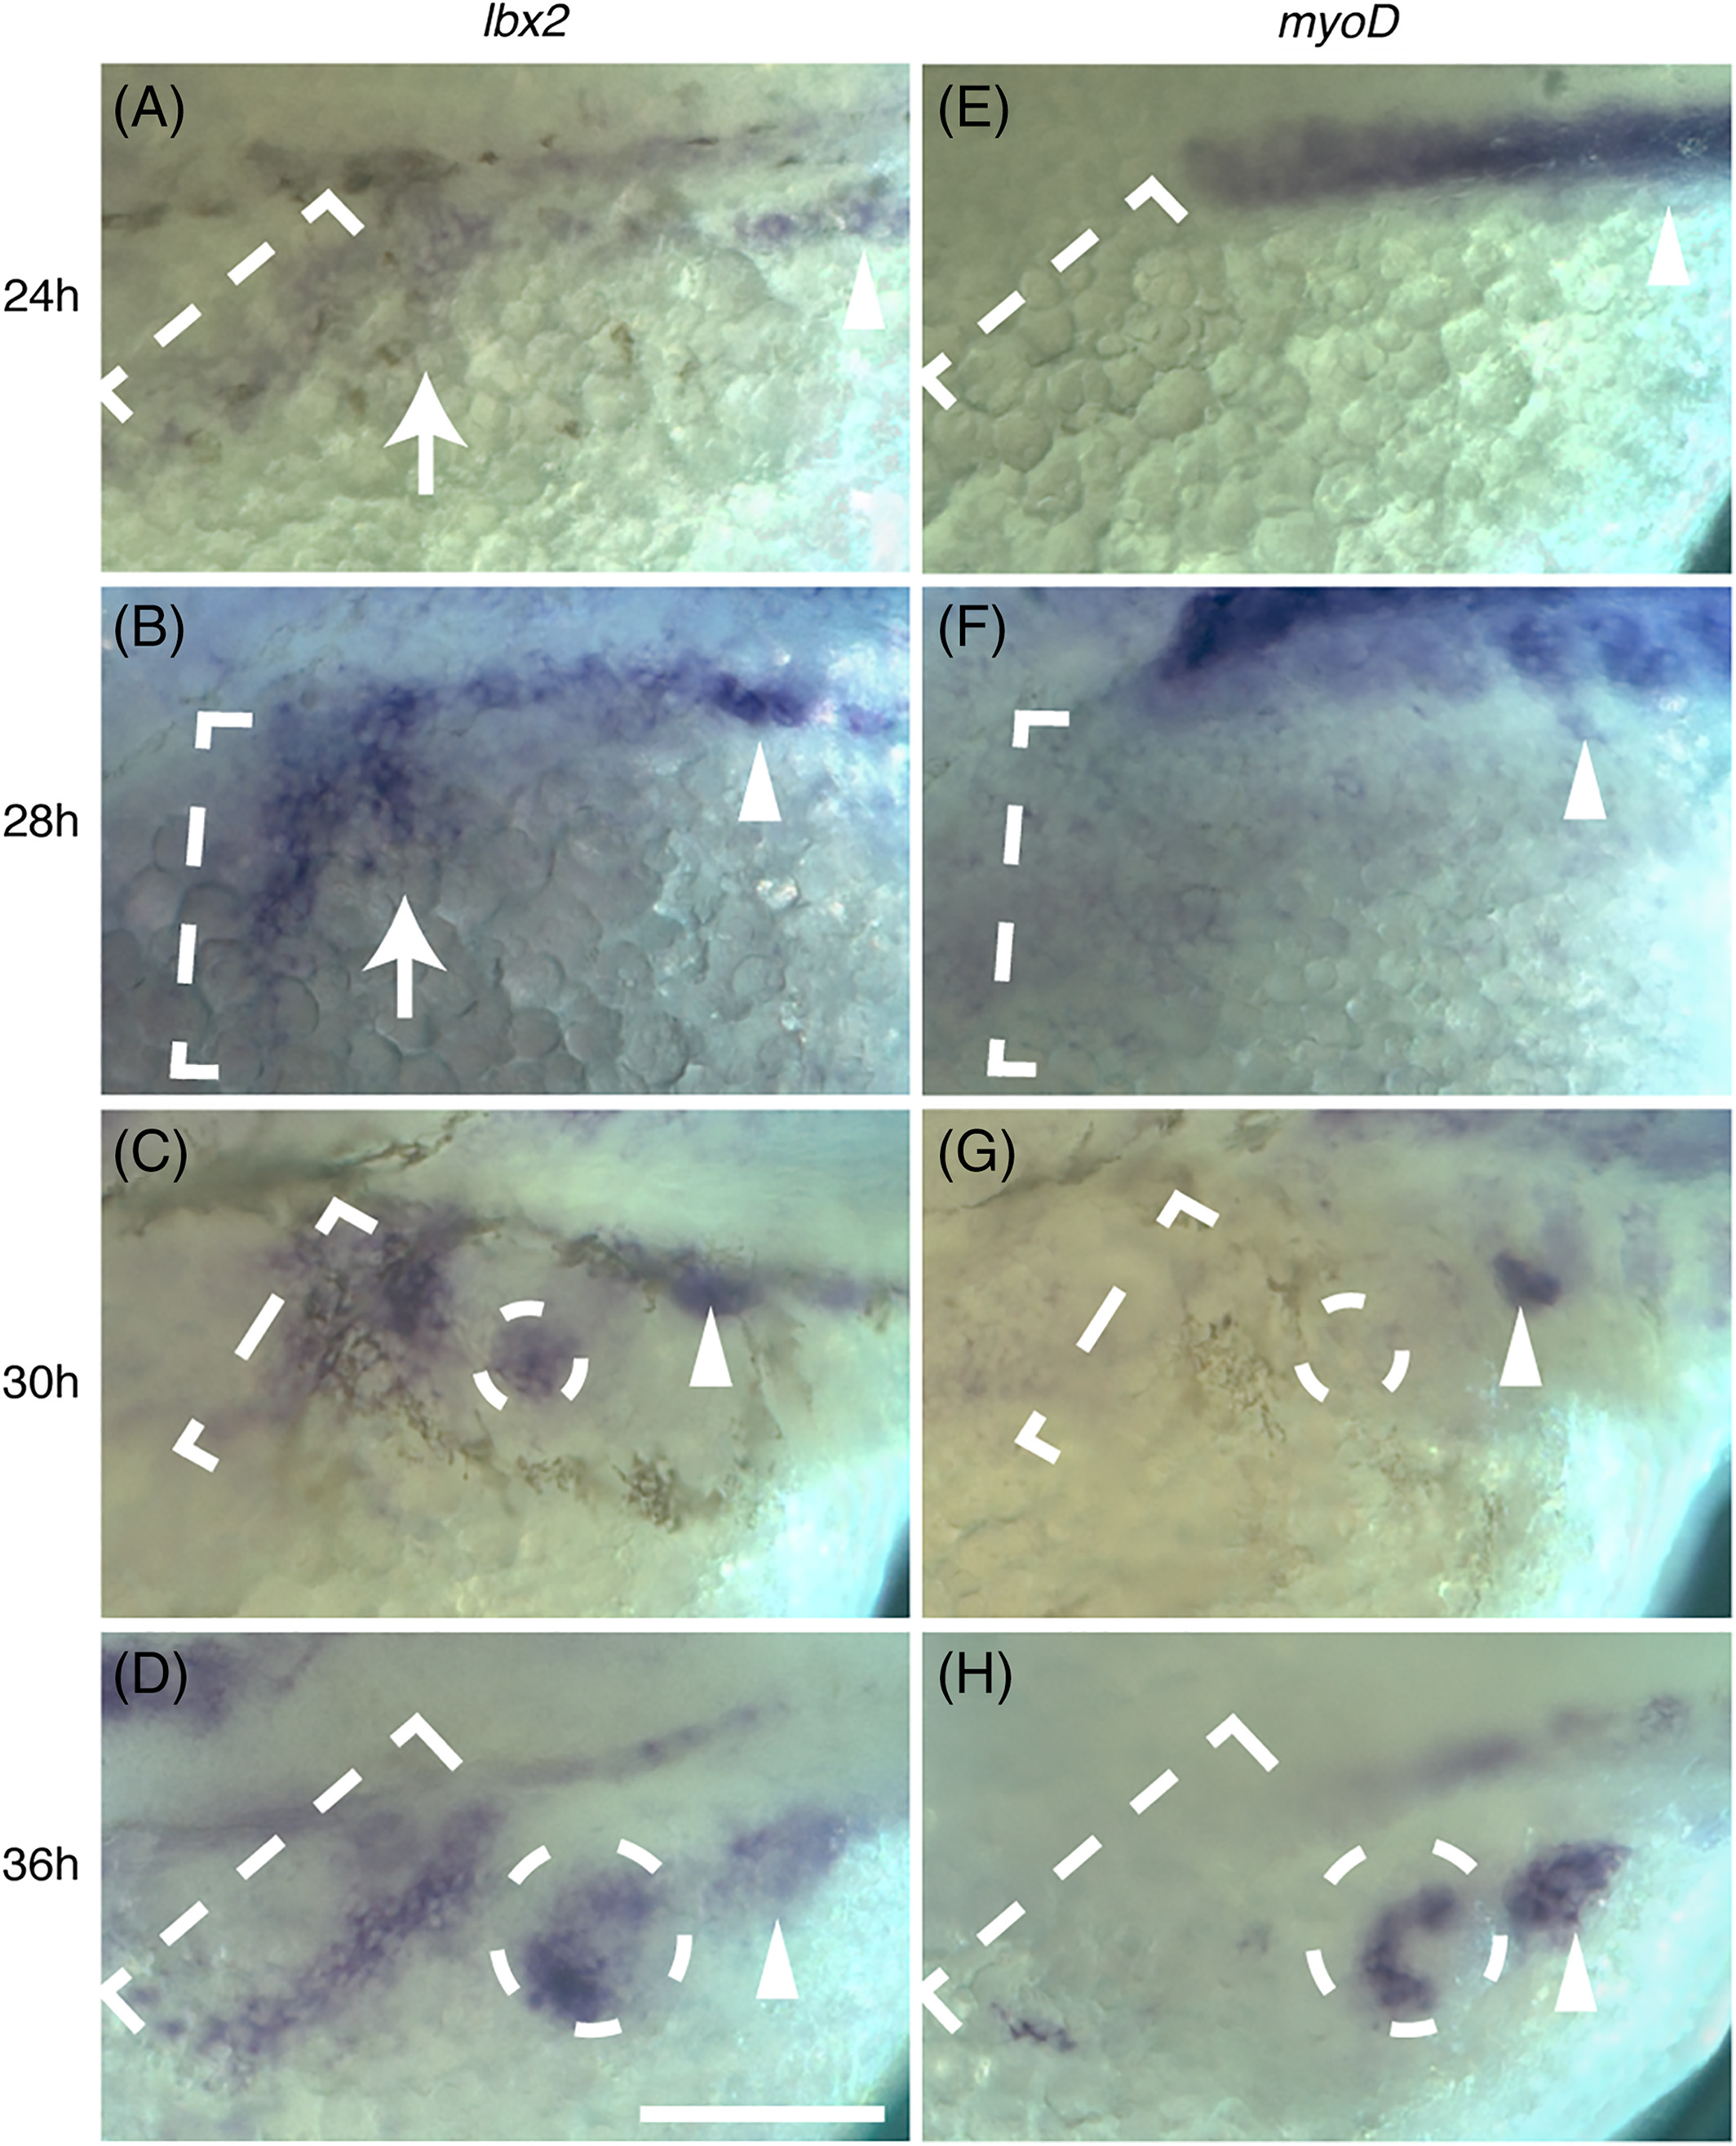
The PHM primordium differs in the timing of gene expression from both the SHM and PFM. Anterior is to the left. Arrow: second lbx2 stream; arrowhead: PHM; dotted circle: PFM; dotted bracket: SHM. A‐D, lbx2 expression between 24 hours and 36 hours. A, dorsal view of lbx2 expression at 24 hours, with two distinct anterior streams of MMPs. B, dorsolateral view of lbx2 expression at 28 hours, with distinct anterior streams and dark ventral somite 5 (arrowhead). C, Dorsolateral view of lbx2 expression at 30 hours, expressed in SHM, PFM, and PHM. D, Dorsal view of lbx2 expression at 36 hours, expressed in SHM, PFM, and PHM. E‐H, myoD expression between 24 hours and 36 hours. E, Dorsal view of myoD expression at 24 hours is restricted to the somites (arrowhead). F, Dorsolateral view of myoD expression at 28 hours showing the earliest evidence of PHM. G, Dorsolateral view of myoD expression at 30 hours showing continued expression in the PHM and still no expression in the SHM or PFM. H, Dorsal view of myoD expression at 36 hours showing continued PHM differentiation, and early SHM and PFM differentiation. Scale bar is 100 μm