
|
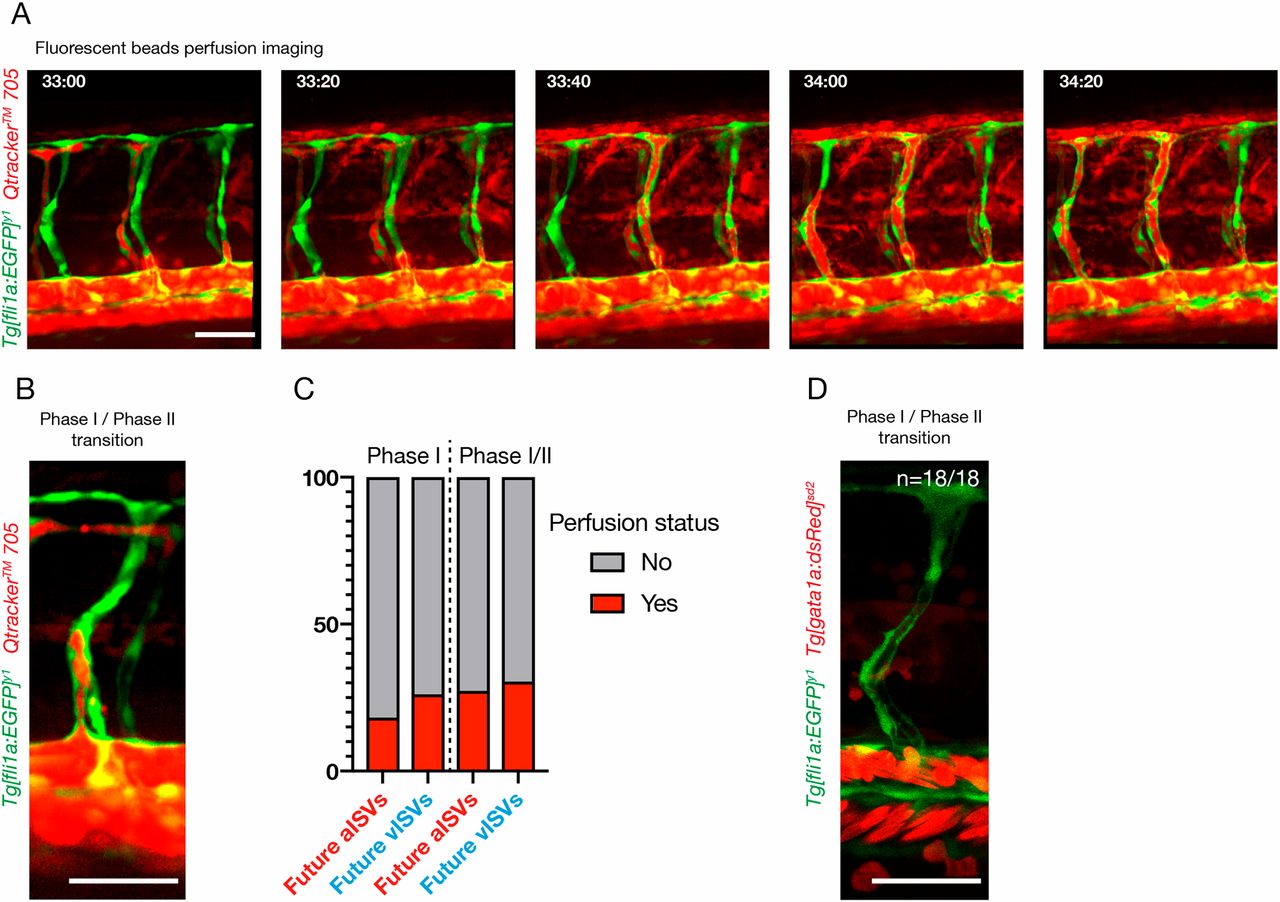
Fig. 4
-
-
The majority of primary ISVs are not perfused prior to connection to the secondary sprouts originated from the PCV. (A) Stills from time-lapse movie of the trunk region of a Tg[fli1a:EGFP]y1embryo showing perfusion with Qtracker 705 quantum dots between 33 and 34:20 hpf. (B) Stills from time-lapse movie of a Tg[fli1a:EGFP]y1 embryo at time of connection of a primary ISV to a secondary sprout (transition from phase I to phase II) injected with Qtracker 705 quantum dots 705 fluorescent beads. (C) Quantification of primary ISV perfusion in phase I and at time of connection to the secondary sprout (phase I/phase II transition). Phase I perfusion is quantified 1 h before connection to the secondary sprout. Perfusion is defined by the continuous labelling of the lumen area ISV with the quantum dots and visible presence of a probable inlet and outlet for flow (n=13 embryos, 23 vISVs, 11 aISVs). (D) Stills from time-lapse movie of a Tg[fli1a:EGFP]y, Tg[gata1a:dsRed]sd2 embryo (labelling ECs in green and blood cells in red) at time of connection of a primary ISV to a secondary sprout (transition from phase I to phase II) (representative of n=7 embryos, 7 aISVs, 11 vISVs). Scale bars: 50 μm.