
|
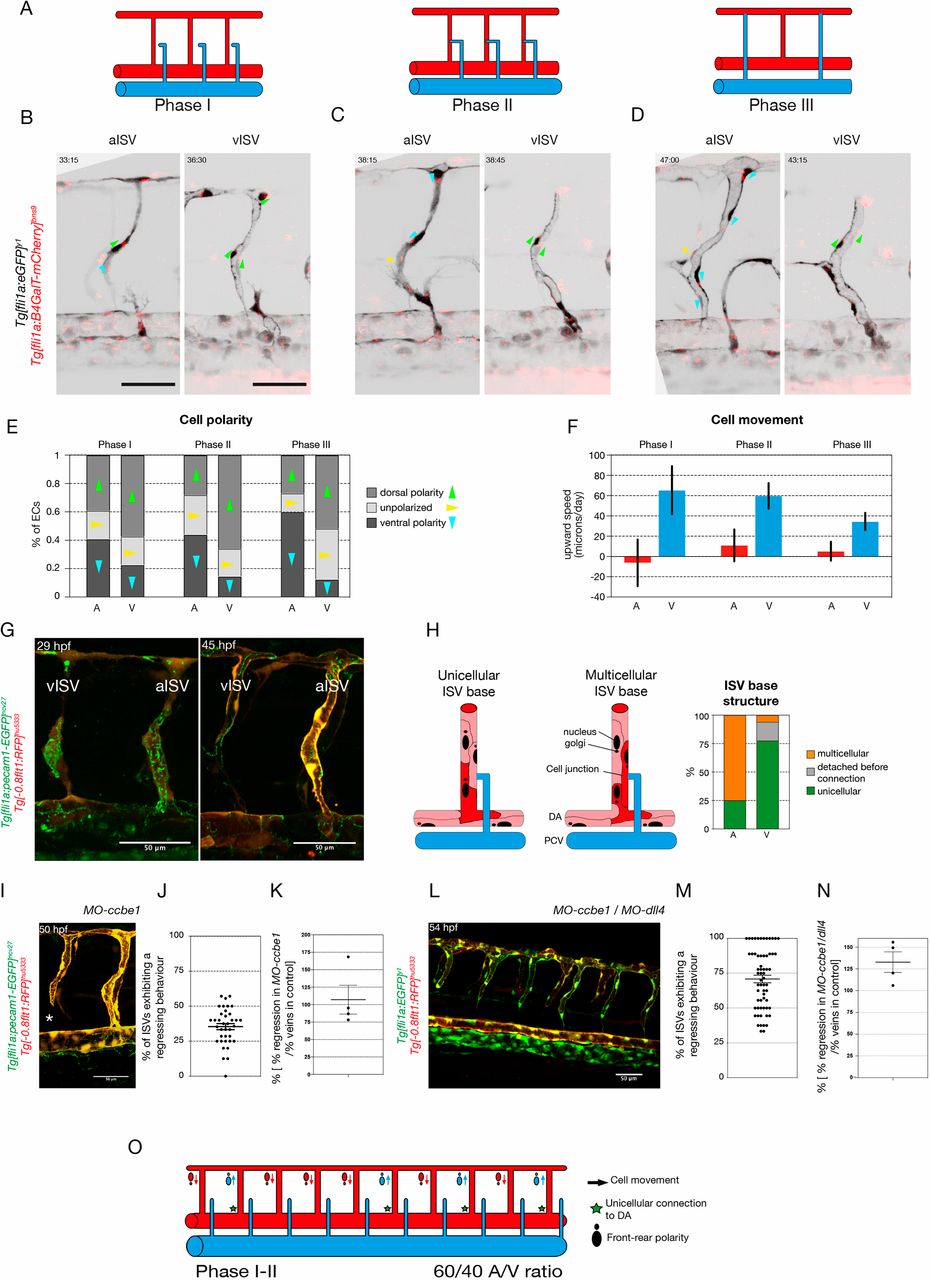
Fig. 3
Primary ISVs are specified into aISVs and vISVs prior to connection by secondary sprouts originating from the PCV. (A) Schematic representation of the three phases of primary ISV remodelling: phase I, before secondary sprout connection to the primary ISV; phase II, when a lumenised connection is formed between the secondary sprout and the primary ISV; phase III, when the three-way connection resolves into aISV or vISV. (B-D) Stills from time-lapse movies (see Movies 4 and 5) of EC polarity in aISVs and vISVs of Tg[fli1a:GFP]y1;Tg[fli1a:B4GalT-mCherry]bns9 embryos during the three different phases: (I) before secondary sprout connection, (II) during three-way connection and (III) after resolution. Arrowheads indicate the angle from the centre of the nucleus to the centre of the Golgi complex: green indicate dorsal polarity; blue indicate ventral polarity; yellow indicate unpolarised ECs. (E) Quantification of EC polarity in aISVs (n=7 aISVs, 16 cells) and vISVs (n=8 vISVs, 17 cells) of Tg[fli1a:GFP]y1;Tg[fli1a:B4GalT-mCherry]bns9 embryos during the three different phases: (I) 2.5 h before secondary sprout connection; (II) during three-way connection; and (III) 2.5 h after resolution. (F) Quantification of EC upward speed (in microns/day) in aISVs (n= 12 aISVs, 67 cells) and vISVs (n=13 vISVs, 103 cells) during the three different phases: (I) 1 h before secondary sprout connection; (II) during three-way connection; and (III) 1 h after resolution. (G) Stills from time-lapse movie (Movie 6) of a Tg[fli1a:pecam1-EGFP]ncv27;Tg[-0.8flt1:RFP]hu5333 embryo showing ISV remodelling into an arterial and a venous intersegmental vessel (aISV and vISV) at 29 and 45 hpf. (H) Quantification of the cellular structure at the base of the primary ISV at the inception of phase II. Detection or absence of GFP expression is used to characterise the nature of the connection (unicellular or multicellular) (n=34 embryos, 12 aISVs, 40 vISVs). (I) Still from a time lapse movie (see Movie 7) of a Tg[fli1a:pecam1-EGFP]ncv27; Tg[-0.8flt1:RFP]hu5333 5 ng MO-ccbe1 embryo showing ISV regression in the absence of secondary sprouting. (J) Quantification of the percentage of primary ISVs exhibiting a regression behaviour (full disconnection from the DA, thin membrane connection to the DA, lumen collapse and reconnection, and cell death at the base of the primary ISV; see Fig. S3) (n=4 experiments, 37 morphants, 241 morphant vessels). (K) Quantification of percentage of primary ISVs exhibiting a regression behaviour in ccbe1 morphants compared with the percentage of veins in control clutch mates (n=37 morphants, n=29 wild-type controls). (L) Stills from time-lapse movie (Movie 8) of a Tg[fli1a:EGFP]y1;Tg[-0.8flt1:RFP]hu5333 5 ng MO-ccbe1/10 ng MO-dll4 embryo showing ISV regression in the absence of secondary sprouting. (M) Quantification of percentage of primary ISV exhibiting a regression behaviour (full disconnection from the DA, thin membrane connection to the DA, lumen collapse and reconnection, and cell death at the base of the primary ISV; see Fig. S2) (n=7 experiments, 62 morphants, 531 morphant vessels). (N) Quantification of percentage of primary ISVs exhibiting a regression behaviour in MO-ccbe1(5 ng)/MO-dll4 (10 ng) double morphants compared with the percentage of veins in control clutch mates (n=62 morphants, n=17 wild-type controls). (O) Schematic representation of ISV specification prior to and at the inception of the three-way connection, quantifiable through EC polarity, upward movement speed and cellular structure at the connection to the dorsal aorta. A, aISV; V, vISV. Scale bars: 50 μm. In J,K,M,N, data are mean± s.e.m. with individual data points indicated.