
|
Fig. S8
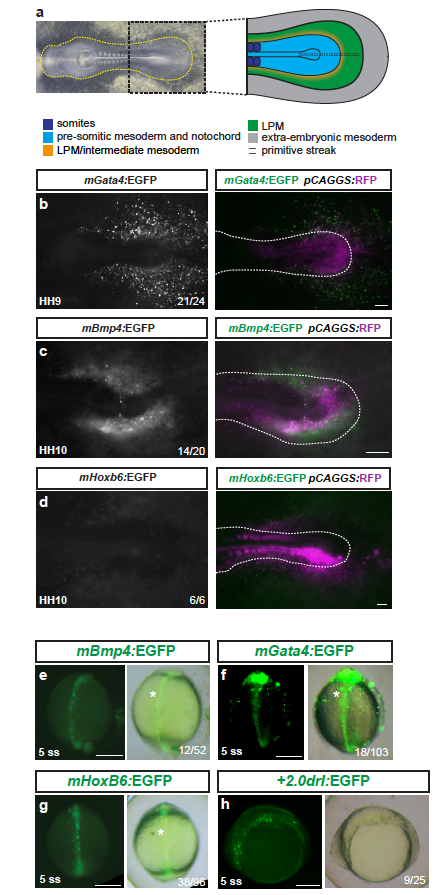
Mouse LPM enhancers show specific activity in chick, but not in zebrafish embryos
(a) Bright field image of an HH10 stage chicken embryo, anterior to the left, with schematic depiction of the posterior body (right), prospective LPM in green. (b-d) Ex ovo-cultured chicken embryos at HH9-HH10, electroporated at HH3+/H4 with reporters based on mouse LPM enhancers from mGata4 (n=21/24) (b), mBmp4 (n=14/20) (c), and mHoxb6 (n=6/6) (d) driving EGFP (grayscale), including a merged overlay together with electroporation marker plasmid pCAGGS:RFP (magenta, driving ubiquitous expression as electroporation control). Dashed lines (b-d) indicate the posterior outline of the individual chicken embryos, marking the predicted boundary between embryo and extra-embryonic tissue. (e-h) Zebrafish embryos depicted at early somitogenesis stages (dorsal views in e-g, lateral view in h) injected with EGFP reporters for mBmp4 (n=12/52) (e), mGata4 (n=18/103) (f), and mHoxb6 (n=38/96) (g) compared to +2.0drl:EGFP (n=9/25) (h), revealing axial mesoderm expression of the tested mouse enhancers. Asterisks point out axial mesoderm expression. Scale bar (b-d) 250 μm, (e-h) 200 μm.