
|
Fig. S6
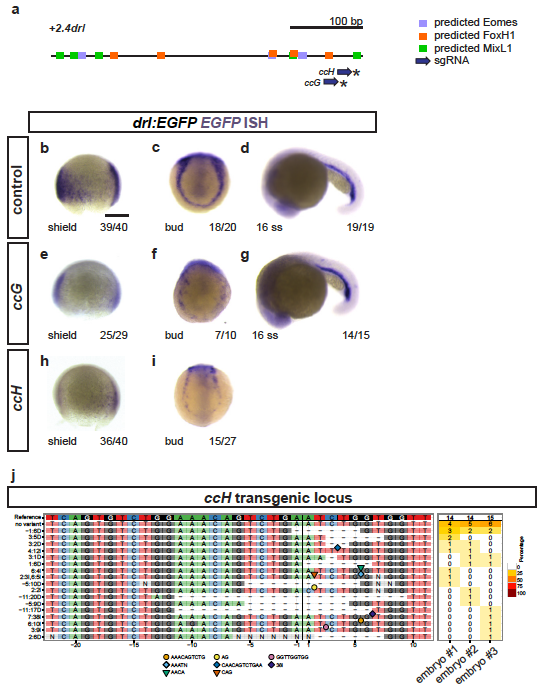
Crispant analysis of the +2.0drl region
(a) Schematic representation of the minimal +2.4drl LPM enhancer region (core of +2.0drl) with Eomes, FoxH1, and Mixl1 binding site predictions (JASPAR) and sgRNAs ccG and ccH annotated. (b-i) ISH for EGFP in +2.0drl:EGFP embryos shown for injection controls (b-d) or individually mutagenized using reconstituted Cas9 protein-sgRNA complexes with either sgRNA (e-g) ccG or (h,i) ccH (asterisks in a), both showing mosaic loss or reduction of reporter expression at shield and bud stage compared to uninjected controls. Reporter expression that is dependent on different regulatory elements remains intact upon mutagenesis with both sgRNAs, as observed at 16 ss (d,g). These results indicate no overt mutagenesis of essential parts in the transgene itself. (j) Panel plot showing mutagenesis efficiency and allele spectrum in three representative ccH crispants, as created by CrispRVariants. The genomic reference sequence is shown on top, with the 20 bp ccH sgRNA followed by a 3 bp PAM indicated by the boxed regions. The Cas9 cleavage site is represented by a black vertical bar. Deletions are indicated by a minus (-) and insertion sequences by symbols. The right column of the plot shows detected allele frequency per analyzed embryo. Scale bar (b) 250 μm.