
|
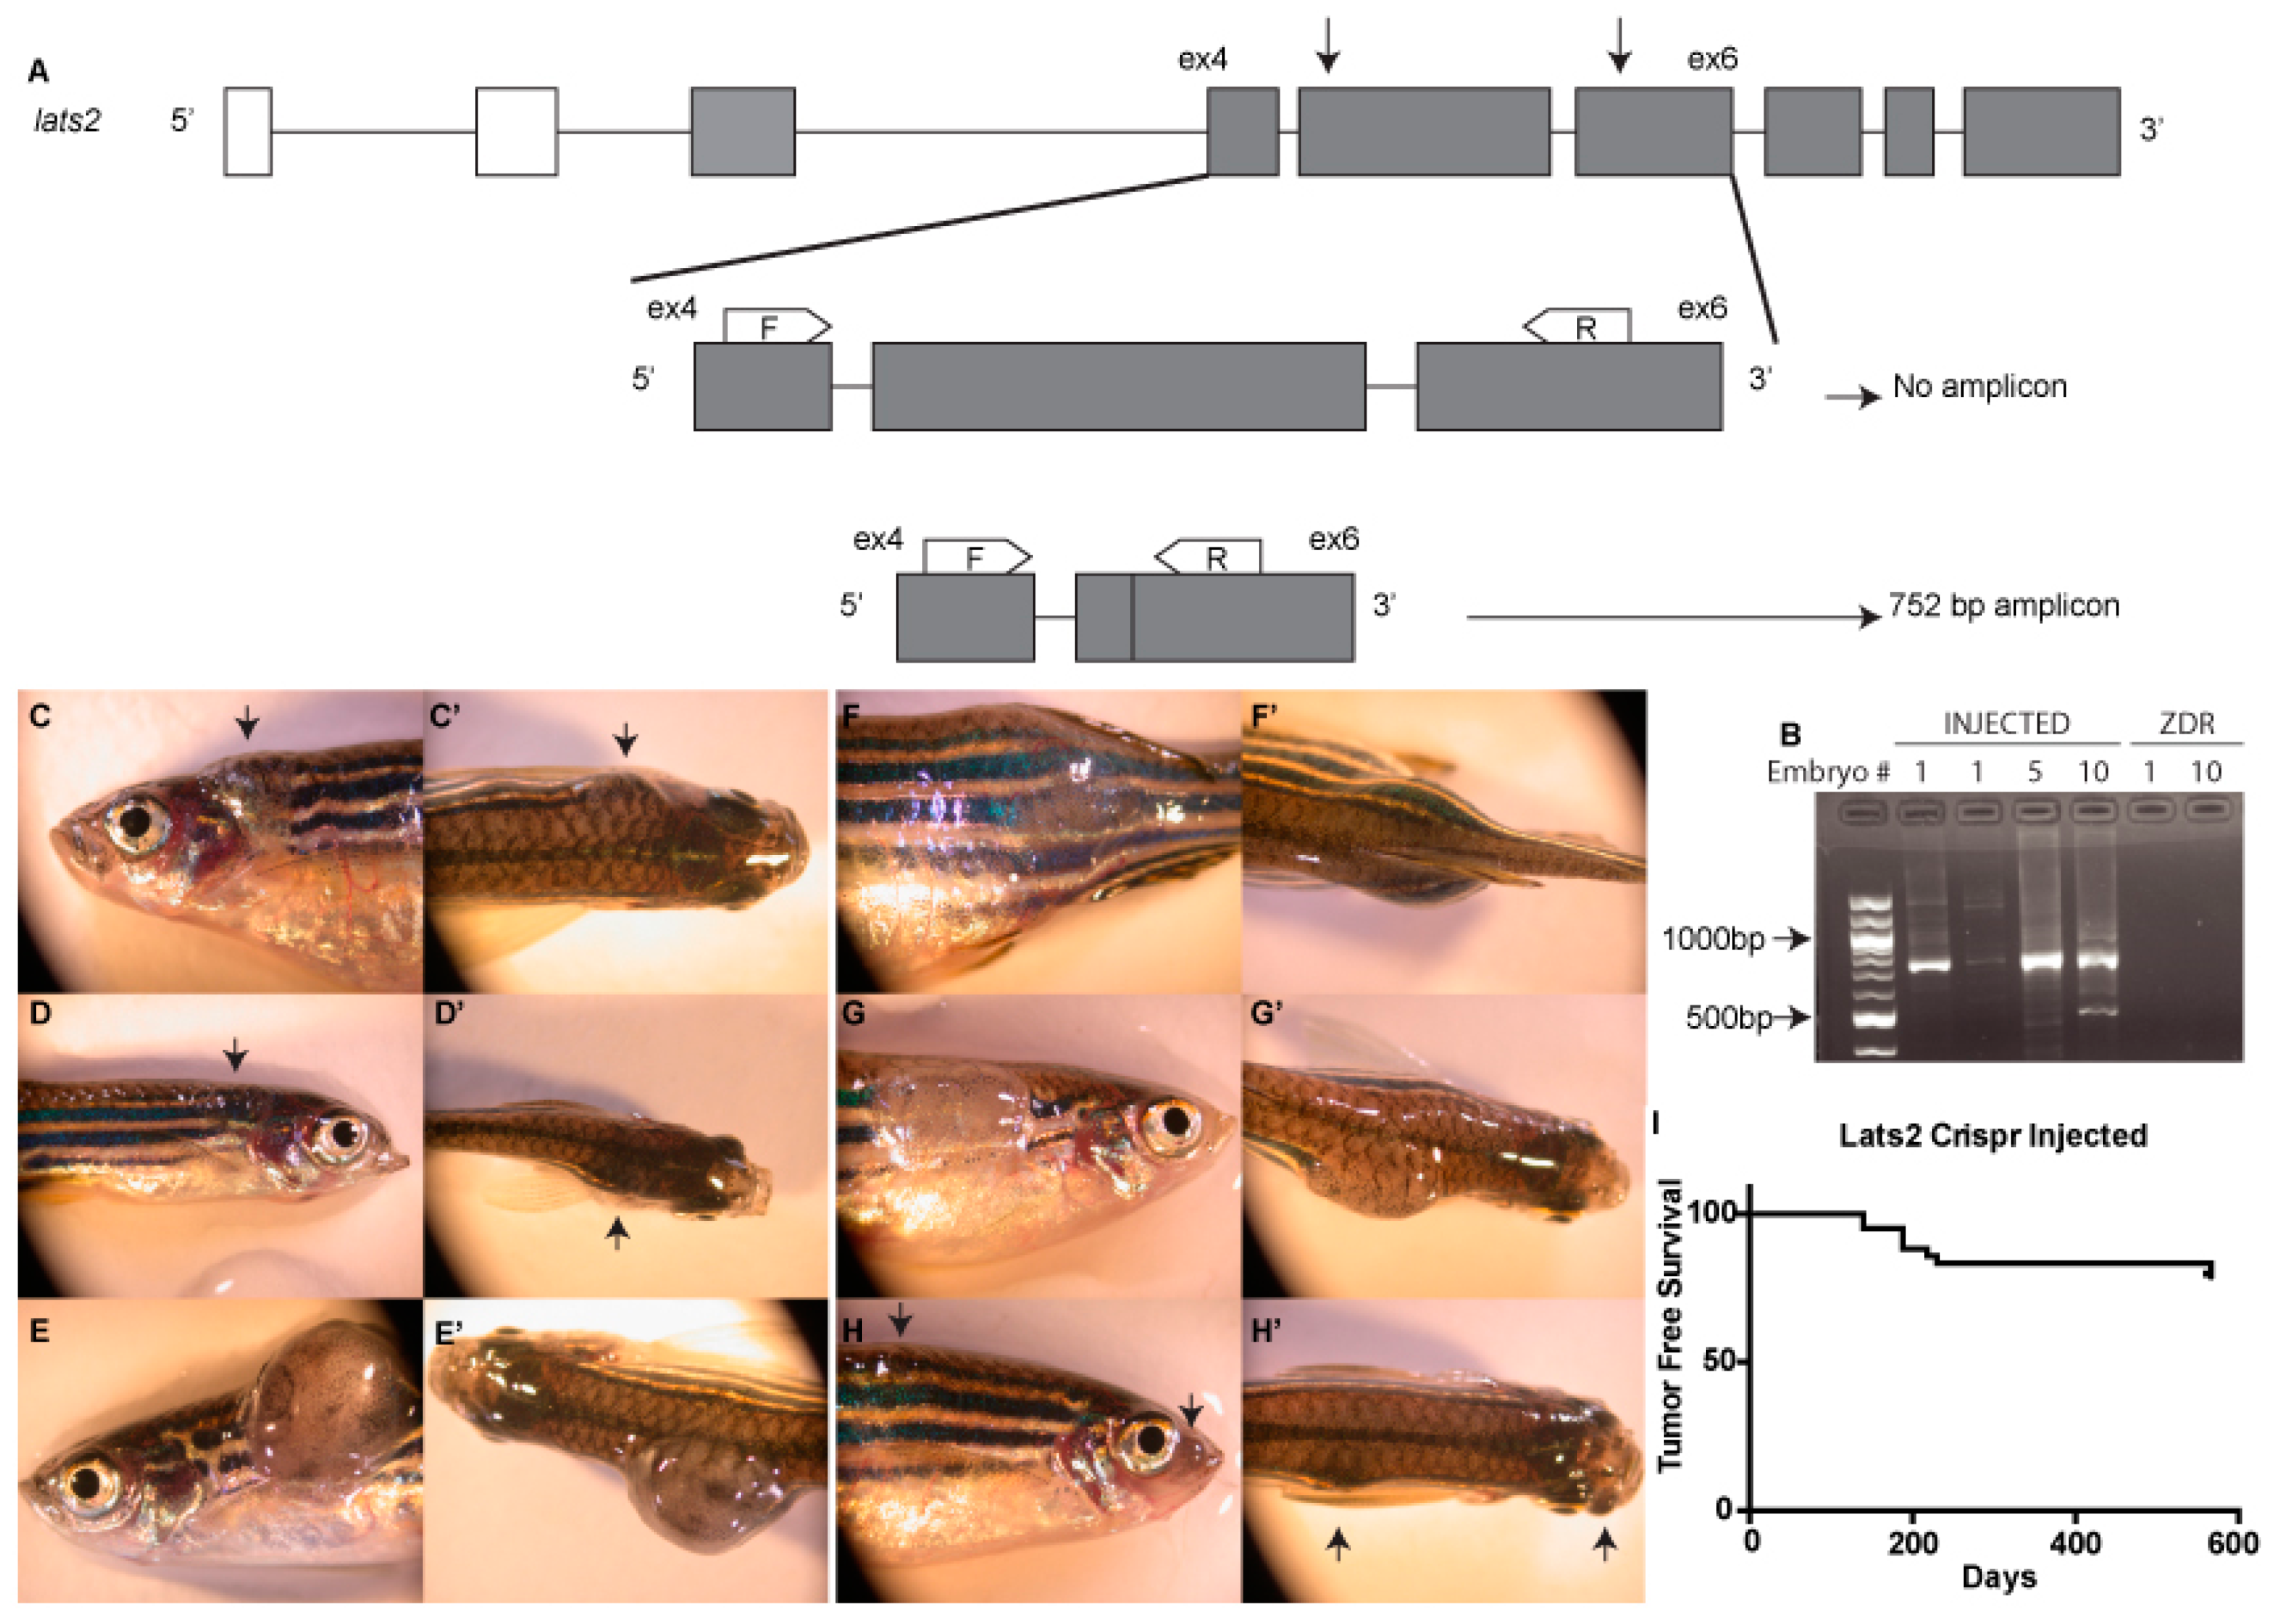
Fig. 1
Injection of two lats2 gRNAs leads to deletions and tumorigenesis. ( A) Schematic depicting the zebrafish lats2 gene and the PCR-based genotyping assay used to identify and differentiate between successful large deletion alleles and WT alleles. Arrows indicate the target sites of the gRNAs used. F refers to a forward primer; R refers to a reverse primer. ( B) Agarose gel separation of PCR amplicons generated based on the genotyping assay depicted in ( A). Amplicons of the correct size, indicative of a large genomic deletion, are present in lats2 CRISPR-injected embryos, but absent in uninjected negative controls. Numbers above lanes represent the number of embryos used as the template DNA for each PCR sample. First lane contains a 100-bp ladder (NEB). ( C– H’) Six examples of lats2 CRISPR-injected fish that developed tumors by 6 mpf. Arrows denote tumors when not obviously visible. ( I) Kaplan‒Meier plot of tumor-free survival in lats2 CRISPR-injected fish.