
|
Fig. S2
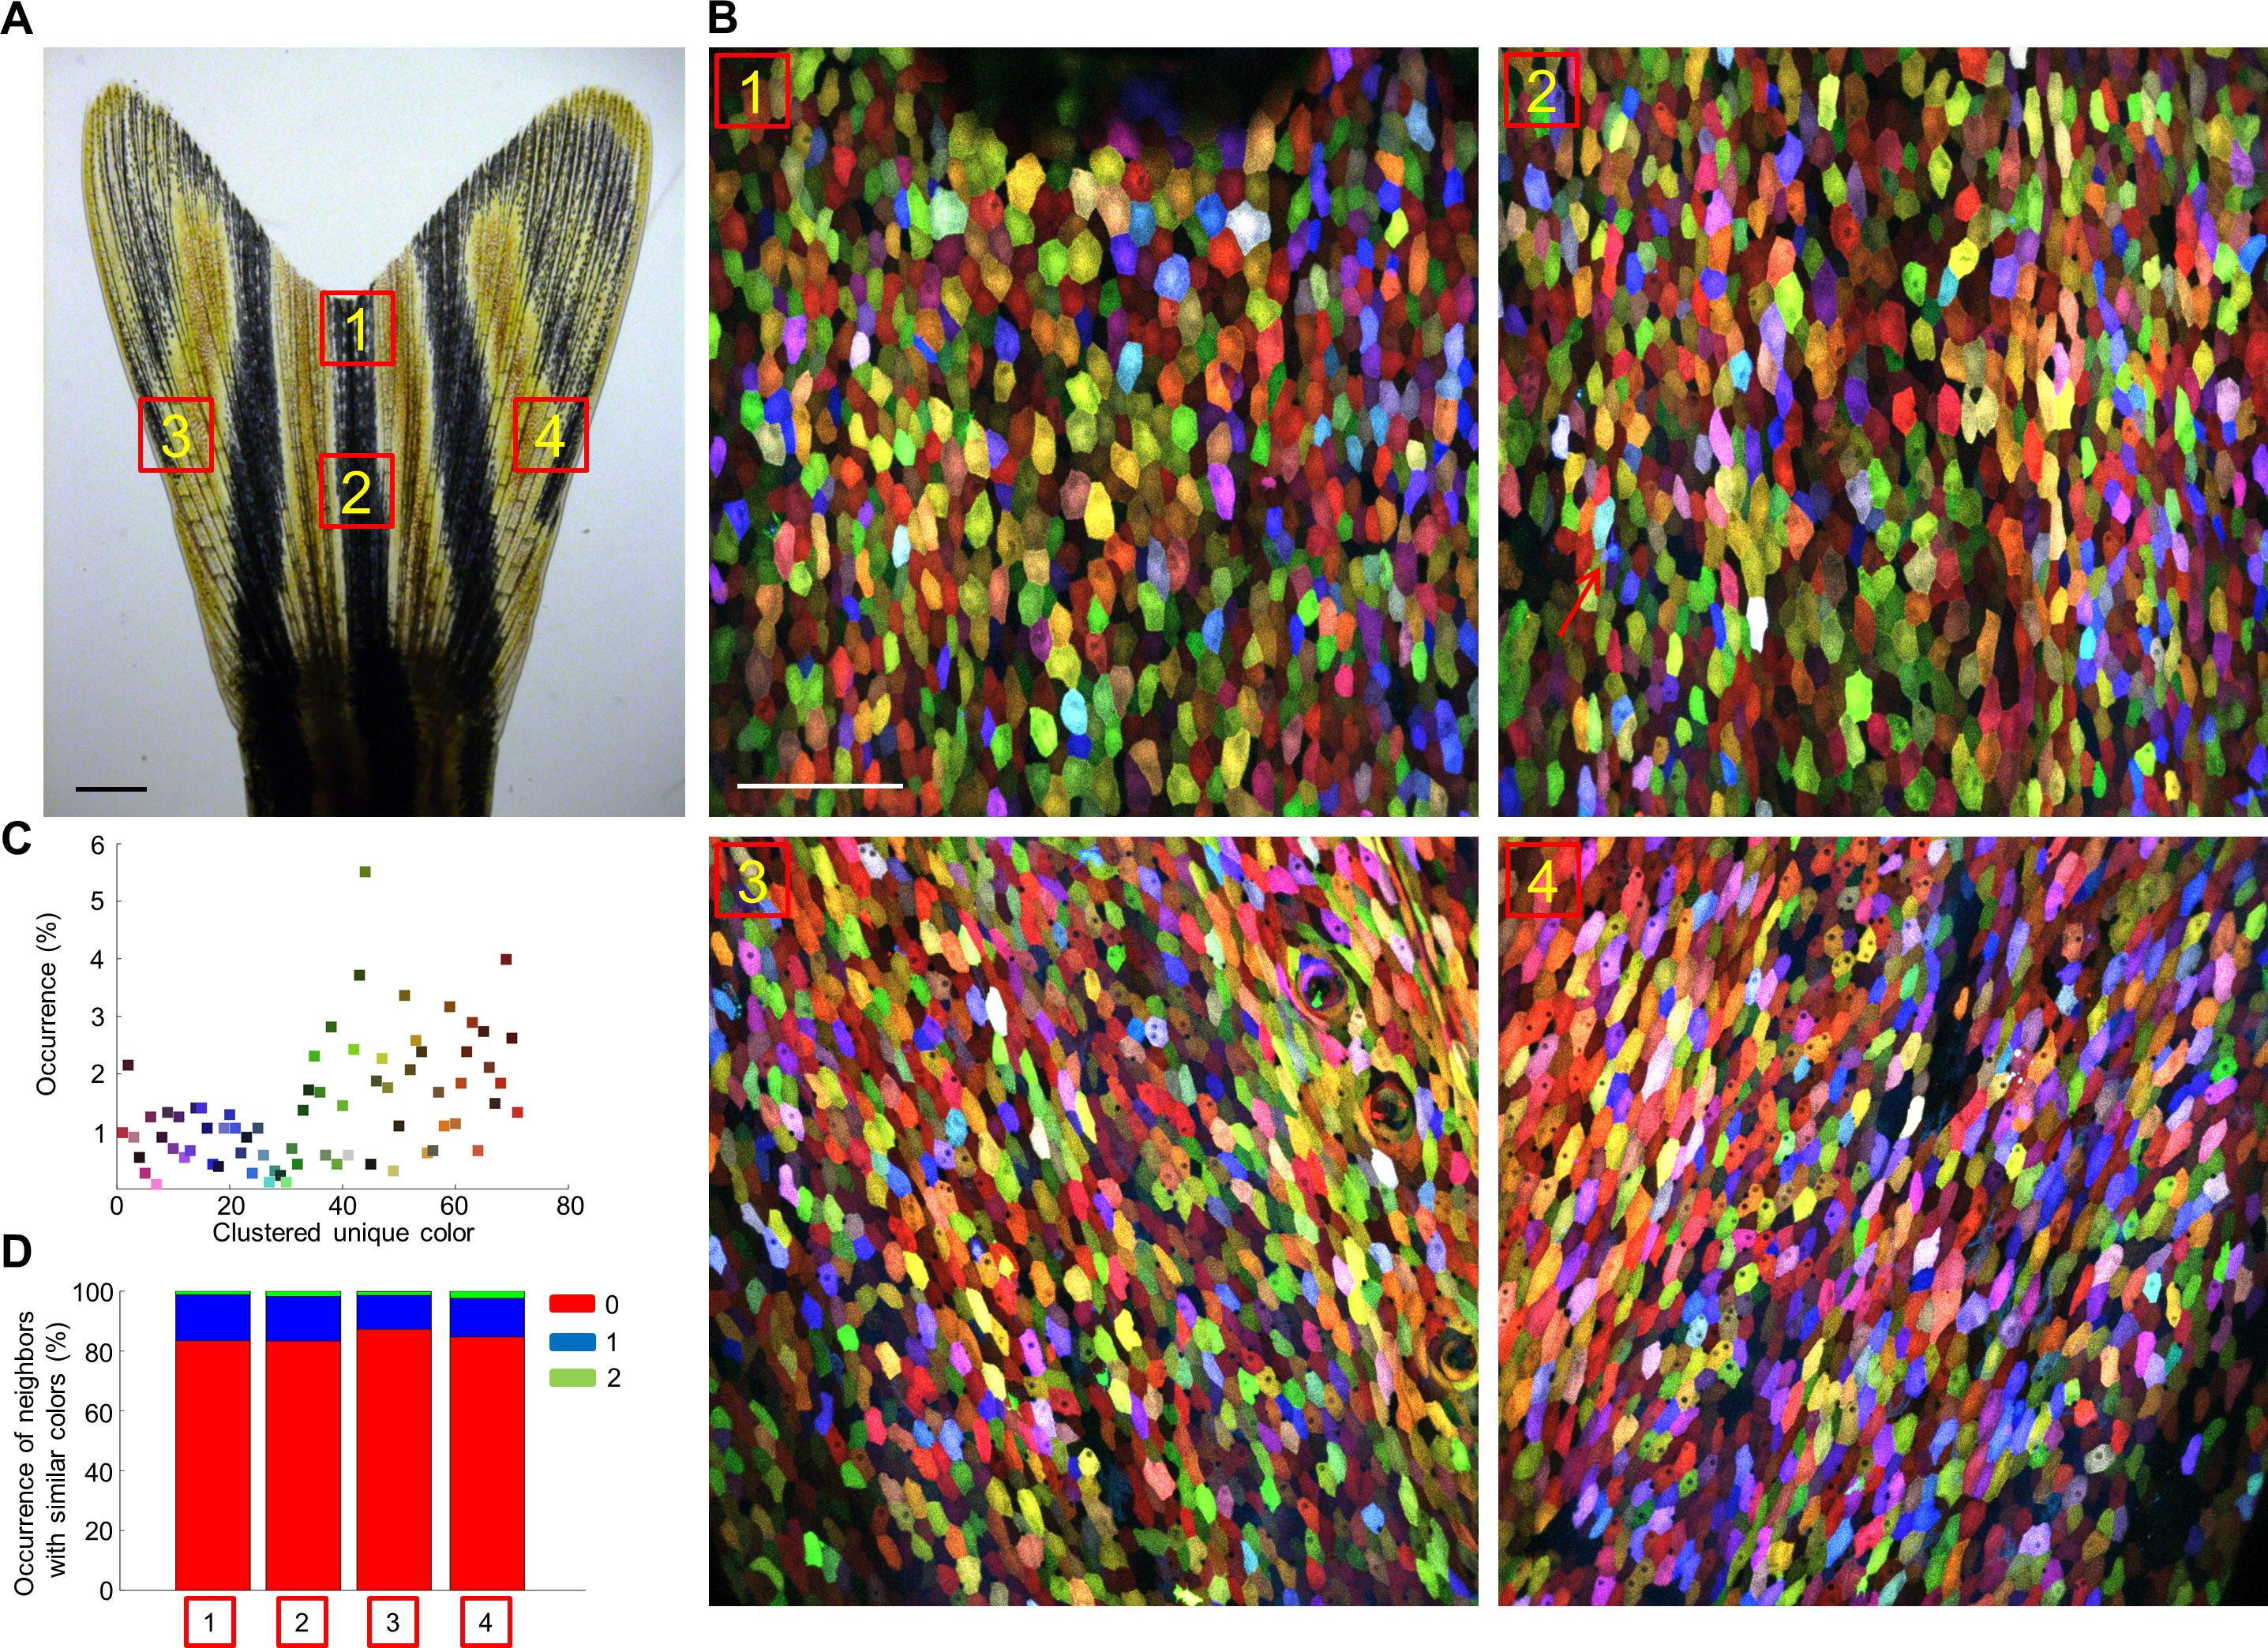
skinbow Labels the Entire Fin Surface with Diverse Colors, Related to Figure 2. (A, B) Brightfield
view of adult zebrafish caudal fin. Scale bars, 1 mm. Red boxes in (A) indicate areas where z-stacked confocal
images (B) were captured. Scale bars, 100 μm. Red arrows in Area-2 point to migratory immune cells, a minor
labeled population. (C) Occurrence of each color cluster. Green, brown and red colors are slightly more frequent
than blue and violet colors (see Experimental Procedures for details). Cells from all 4 areas shown in (B) were
combined for analysis. (D) To evaluate the spatial randomness of the color, we quantified occurrence of cells from
all 4 areas shown in (B) with nearest neighbors of the same color cluster. Red, blue, and green areas in the row
stacked plot represent cases with 0, 1, or 2 same-color neighbors, respectively.
Reprinted from Developmental Cell, 36, Chen, C.H., Puliafito, A., Cox, B.D., Primo, L., Fang, Y., Di Talia, S., Poss, K.D., Multicolor Cell Barcoding Technology for Long-Term Surveillance of Epithelial Regeneration in Zebrafish, 668-80, Copyright (2016) with permission from Elsevier. Full text @ Dev. Cell