
|
Fig. 6
Acquisition of Surface Epithelium from Pre-existing and De Novo Pools during Fin Regeneration
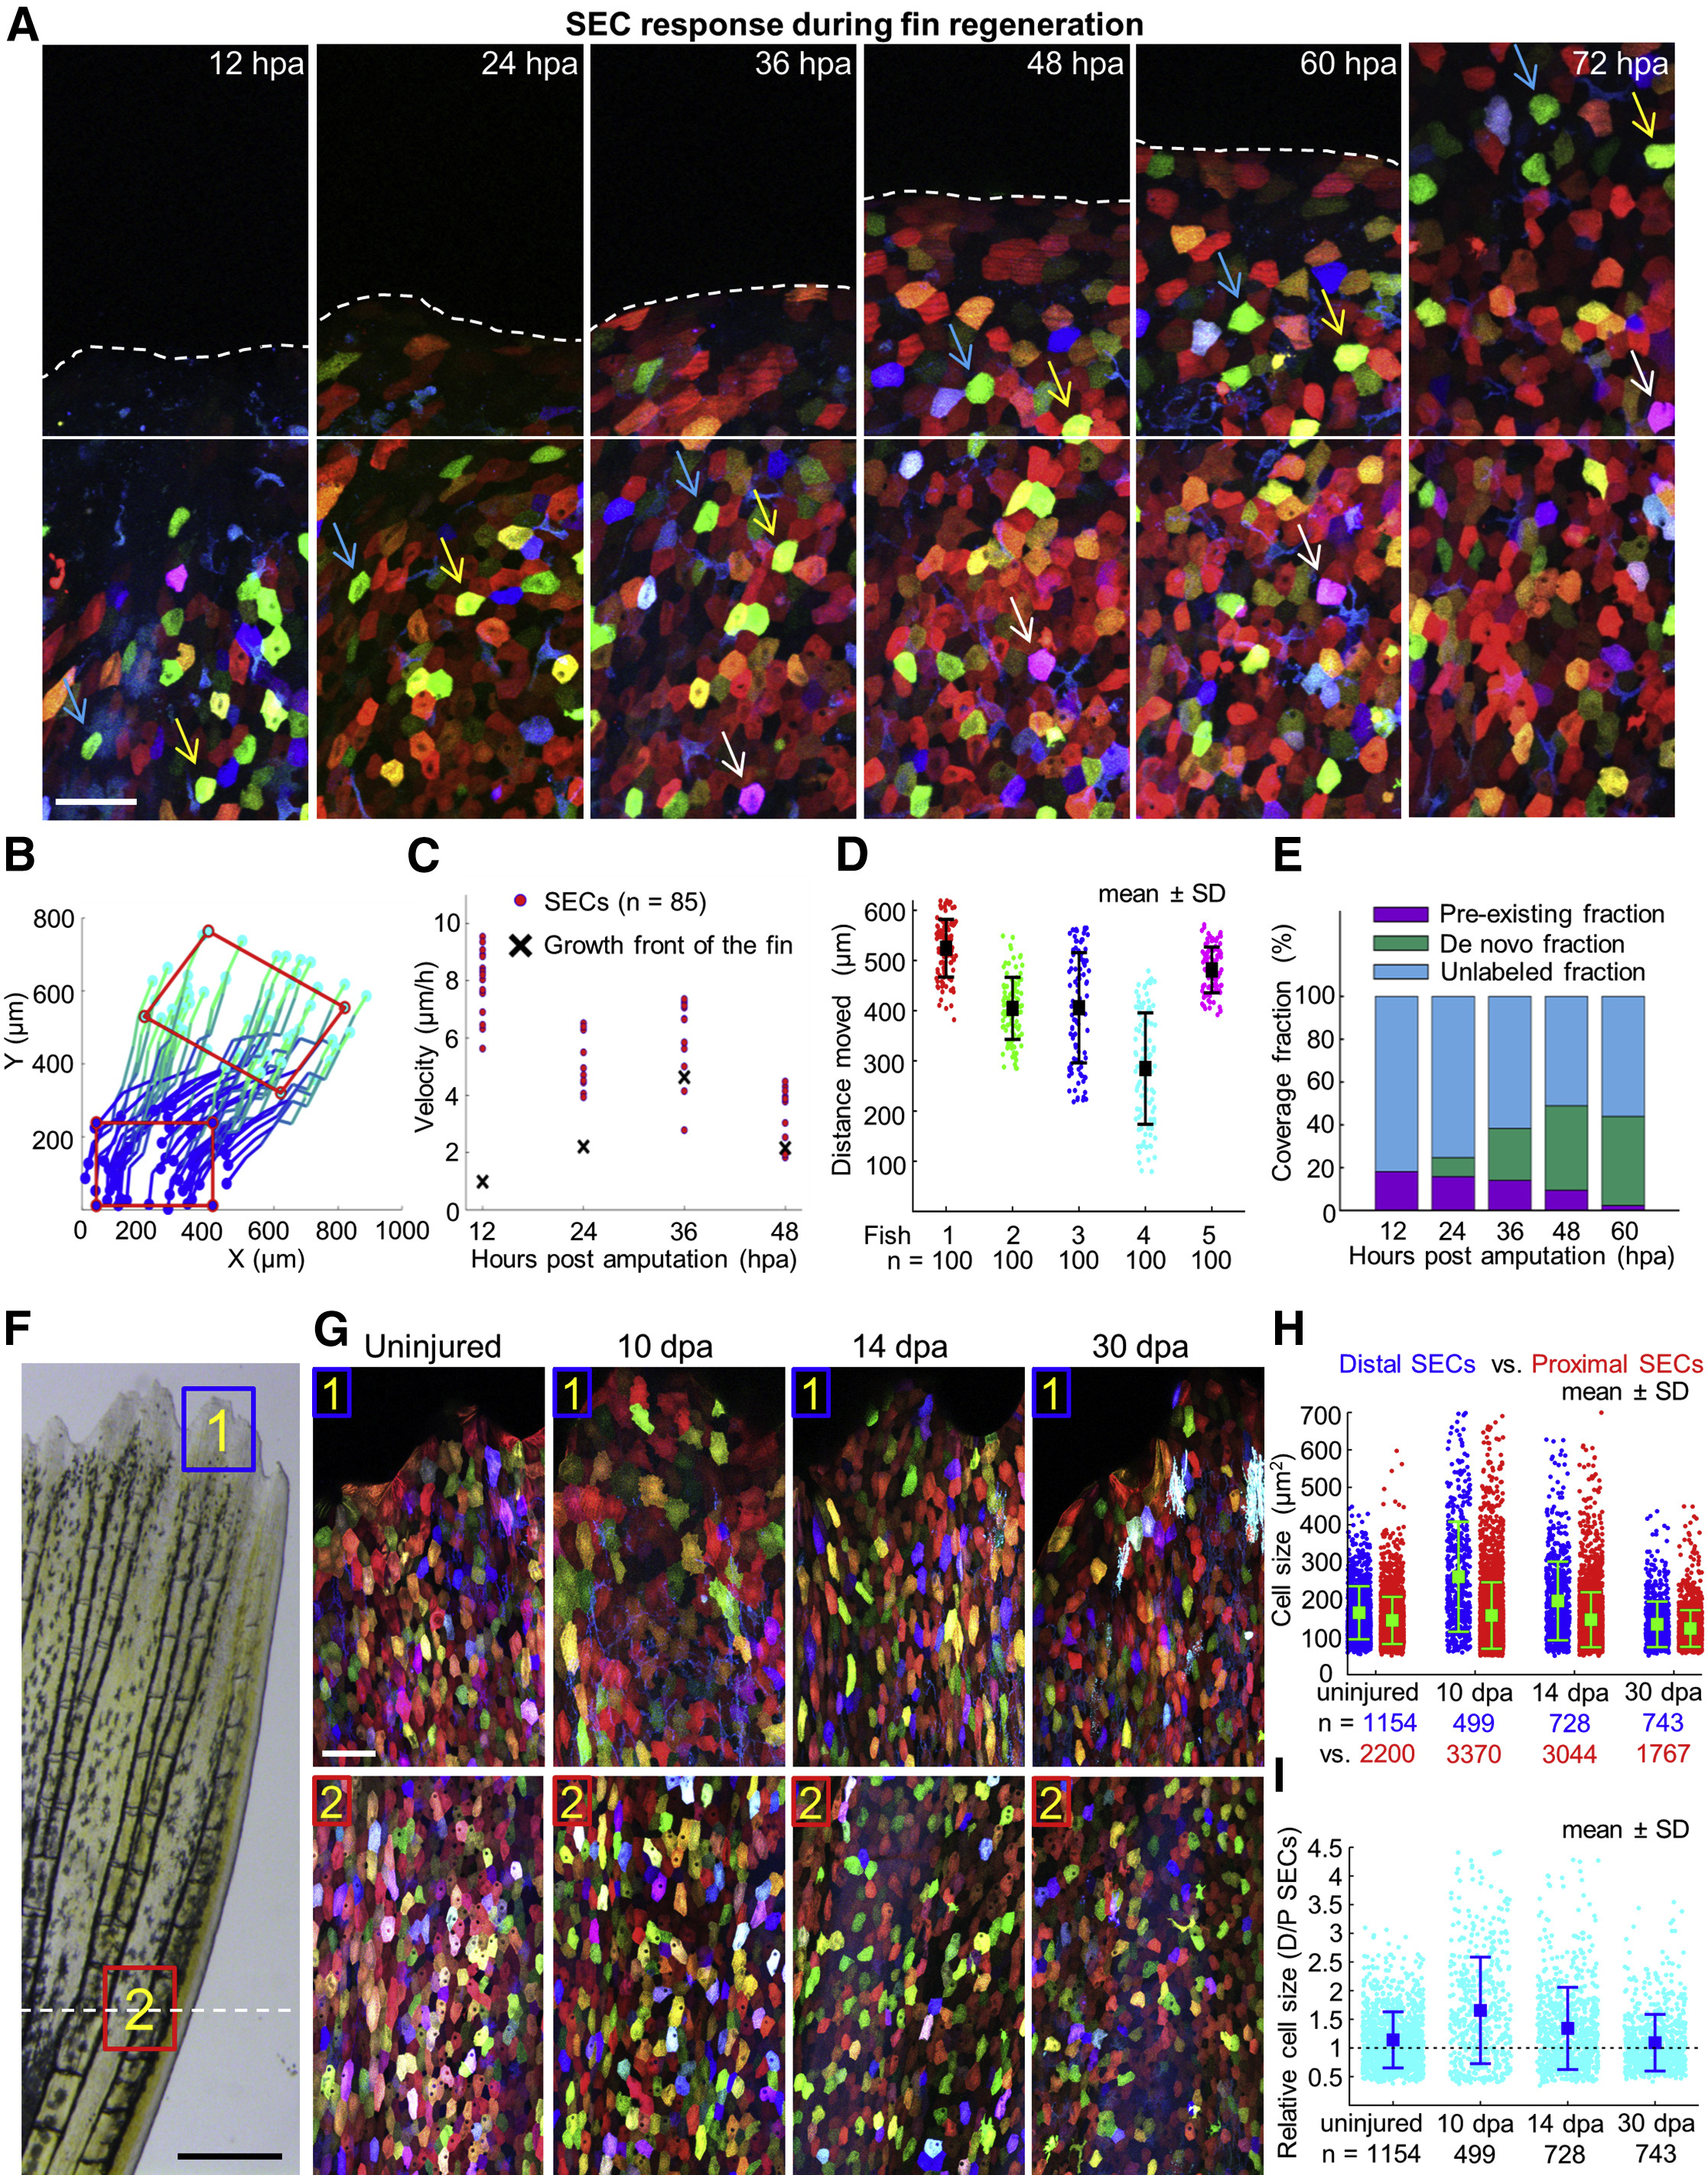
(A) Time-lapse images of an amputated skinbow fin during regeneration. Images were captured once each 12 hr over a 4-day period. White dashed line marks the growth front. White solid line indicates the amputation plane. Blue, yellow, and white arrows point to individual cells across consecutive imaging times. Scale bars, 50 μm.
(B) Reconstruction of trajectories from one representative animal. Each line here represents a reconstructed trajectory of a migratory cell. Color codes for time (i.e., dark blue is the beginning of each trajectory, 12 hpa, and cyan is the end, 96 hpa). To better visualize the movement of cells within the epidermis, a red rectangle indicates positions in the initial and final frames. The rectangle is translocated and deformed, revealing both cell migration and deformation of the tissue. Rightward movement of the cells likely reflects the stereotypical growth pattern of the lateral portion of the dorsal lobe, from which images were captured.
(C) Quantification of velocities of individual cells (red dots; n = 85). The velocity of the moving growth front is marked with a black cross.
(D) Quantitative analysis of average SEC distances traveled between 12 and 96 hpa. 100 reconstructed trajectories each from five animals were considered. Bars indicate mean ± SD.
(E) Quantitative analysis representing SEC contribution from de novo creation versus that generated by migration of SECs identified at 12 hpa. We tracked the region, initially located proximal to the amputation plane at 12 hpa, by reconstructing cell movements at large-scale (Figure S6B). The extent of unlabeled regions of SECs already present at 12 hpa (pre-existing fraction) and of SECs that appear over the course of the experiment (de novo fraction) is quantified at each time. The contribution of newly added SECs was calculated as the difference between the labeled and pre-existing fractions.
(F) Brightfield view of a fin at 10 dpa. Scale bars, 0.5 mm. Blue and red boxes indicate areas where z stacked confocal images in (G) were captured. White dashed line indicates the amputation plane. Scale bar, 50 μm.
(G) Images of skinbow SECs from distal (#1) and proximal (#2) regions of the same fin for each individual at 10, 14, and 30 dpa. At 10 dpa, distal SECs are visibly larger than proximal SECs. Scale bars, 50 μm.
(H) Quantification of cell size for proximal (red) and distal SECs (blue) in regenerating fins (n = 5 animals for each time). Total numbers of analyzed cells are indicated below each point cloud. Bars indicate mean ± SD. Statistical significance between proximal and distal SEC cell sizes in 10 dpa and 14 dpa samples was assessed by a one-tailed t test, p < 10−5. Cell sizes indicate sampled population averages of cells at all stages of surface life from fins that would not display any effects of repetitive imaging.
(I) Quantification of fold change in cell size for proximal (red) and distal SECs (blue) in regenerating fins. Total numbers of analyzed cells are indicated below each point cloud. Bars indicate mean ± SD. The cell size ratio (distal SECs/proximal SECs) steadily decreases from 1.65 ± 0.04 (10 dpa), to 1.34 ± 0.03 (14 dpa), to 1.09 ± 0.03 (30 dpa). Uninjured fins have a ratio of 1.14 ± 0.01.
Reprinted from Developmental Cell, 36, Chen, C.H., Puliafito, A., Cox, B.D., Primo, L., Fang, Y., Di Talia, S., Poss, K.D., Multicolor Cell Barcoding Technology for Long-Term Surveillance of Epithelial Regeneration in Zebrafish, 668-80, Copyright (2016) with permission from Elsevier. Full text @ Dev. Cell