
|
Fig. S2
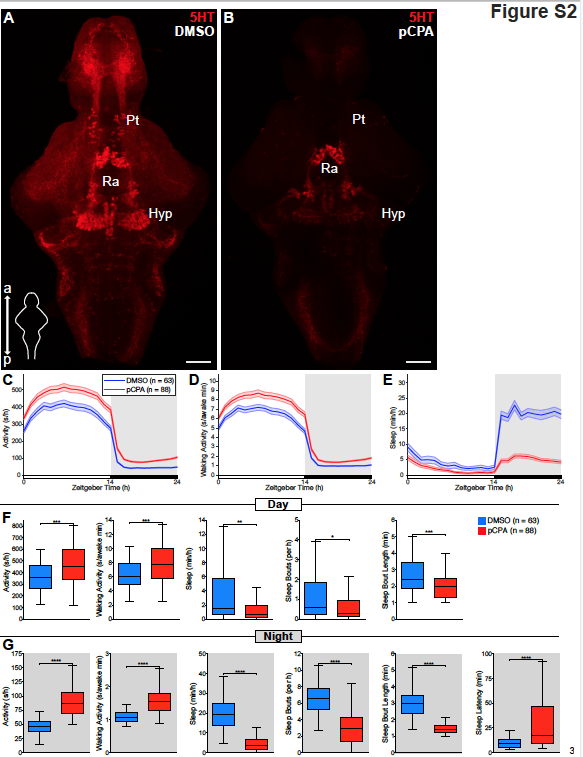
pCPA treatment depletes brain 5-HT and decreases sleep in zebrafish, related to Figure 1.
(A and B) Maximum intensity projections of dissected brains from 5 dpf zebrafish treated with either DMSO vehicle (A) or pCPA (B) and immunostained for 5-HT. Scale bar, 50 μm; a, anterior; p, posterior; Ra, raphe; Hyp, hypothalamus; Pt, pretectal area.
(C-E) Activity (C), waking activity (D), and sleep (E) for zebrafish treated with DMSO vehicle (blue) or 7.5 μM pCPA (red). Line and shading represent mean ± s.e.m. n = number of animals.
(F and G) Boxplots quantifying activity, waking activity, sleep, sleep bout number, sleep bout length during day
(F) and night (G) and sleep latency during night (G). n = number of animals. ns p>0.05, *p<0.05, **p<0.01, ***p< 0.001, ****p<0.0001, Mann-Whitney test