
|
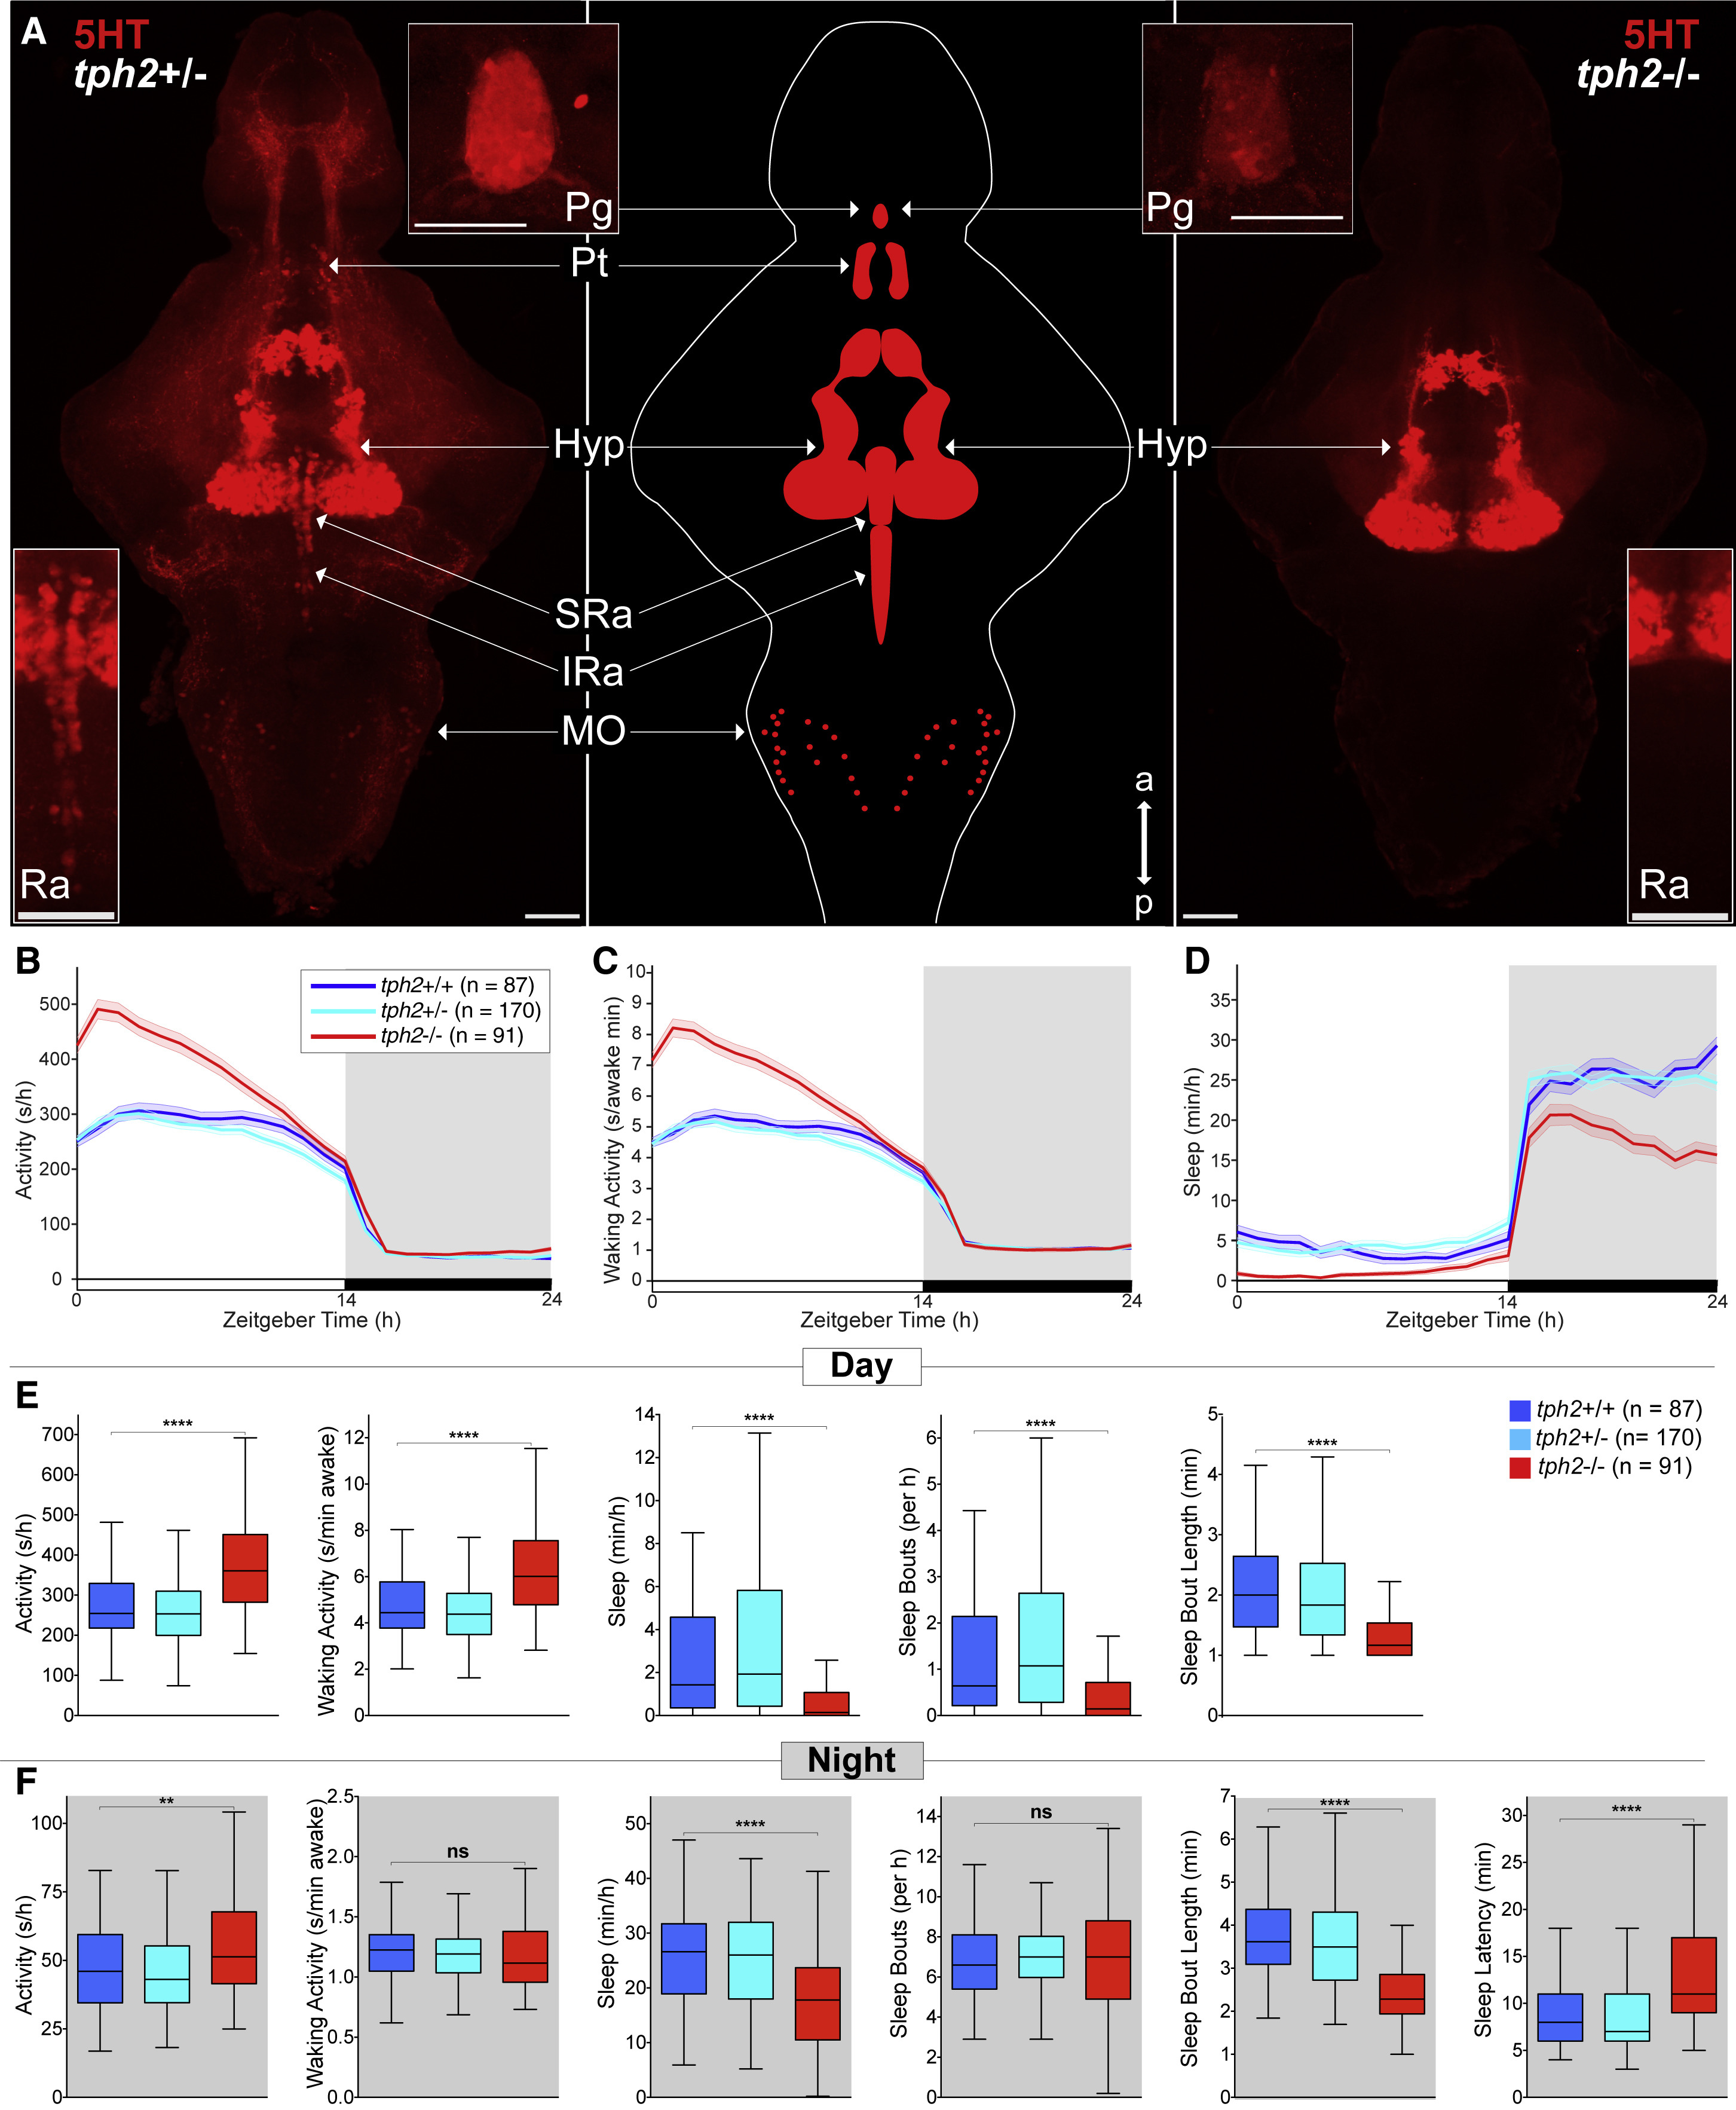
Fig. 1
tph2−/− Zebrafish Are More Active and Sleep Less
(A) Maximum intensity projections of 5 days post-fertilization (dpf) tph2+/− (left) or tph2−/− (right) zebrafish brains immunostained for 5-HT. Middle: brain schematic. Top insets: 5-HT immunostaining of the pineal gland. Bottom insets: magnified view of the raphe. Scale bars, 50 μm. a, anterior; p, posterior; Pg, pineal gland; Pt, pretectal area; Hyp, hypothalamus; Ra, raphe; SRa, superior raphe; IRa, inferior raphe; MO, medulla oblongata.
(B–D) Activity (B), waking activity (C), and sleep (D) for tph2+/+ (blue), tph2+/− (cyan), and tph2−/− (red) zebrafish. Line and shading represent mean ± SEM.
(E and F) Activity, waking activity, sleep, sleep bout number, sleep bout length during day (E) and night (F), and sleep latency at night (F).
n, number of animals. Not significant (ns) p > 0.05, ∗p < 0.05, ∗∗p < 0.01, ∗∗∗p < 0.001, ∗∗∗∗p < 0.0001, Kruskal-Wallis test with Dunn’s multiple comparisons test.