
|
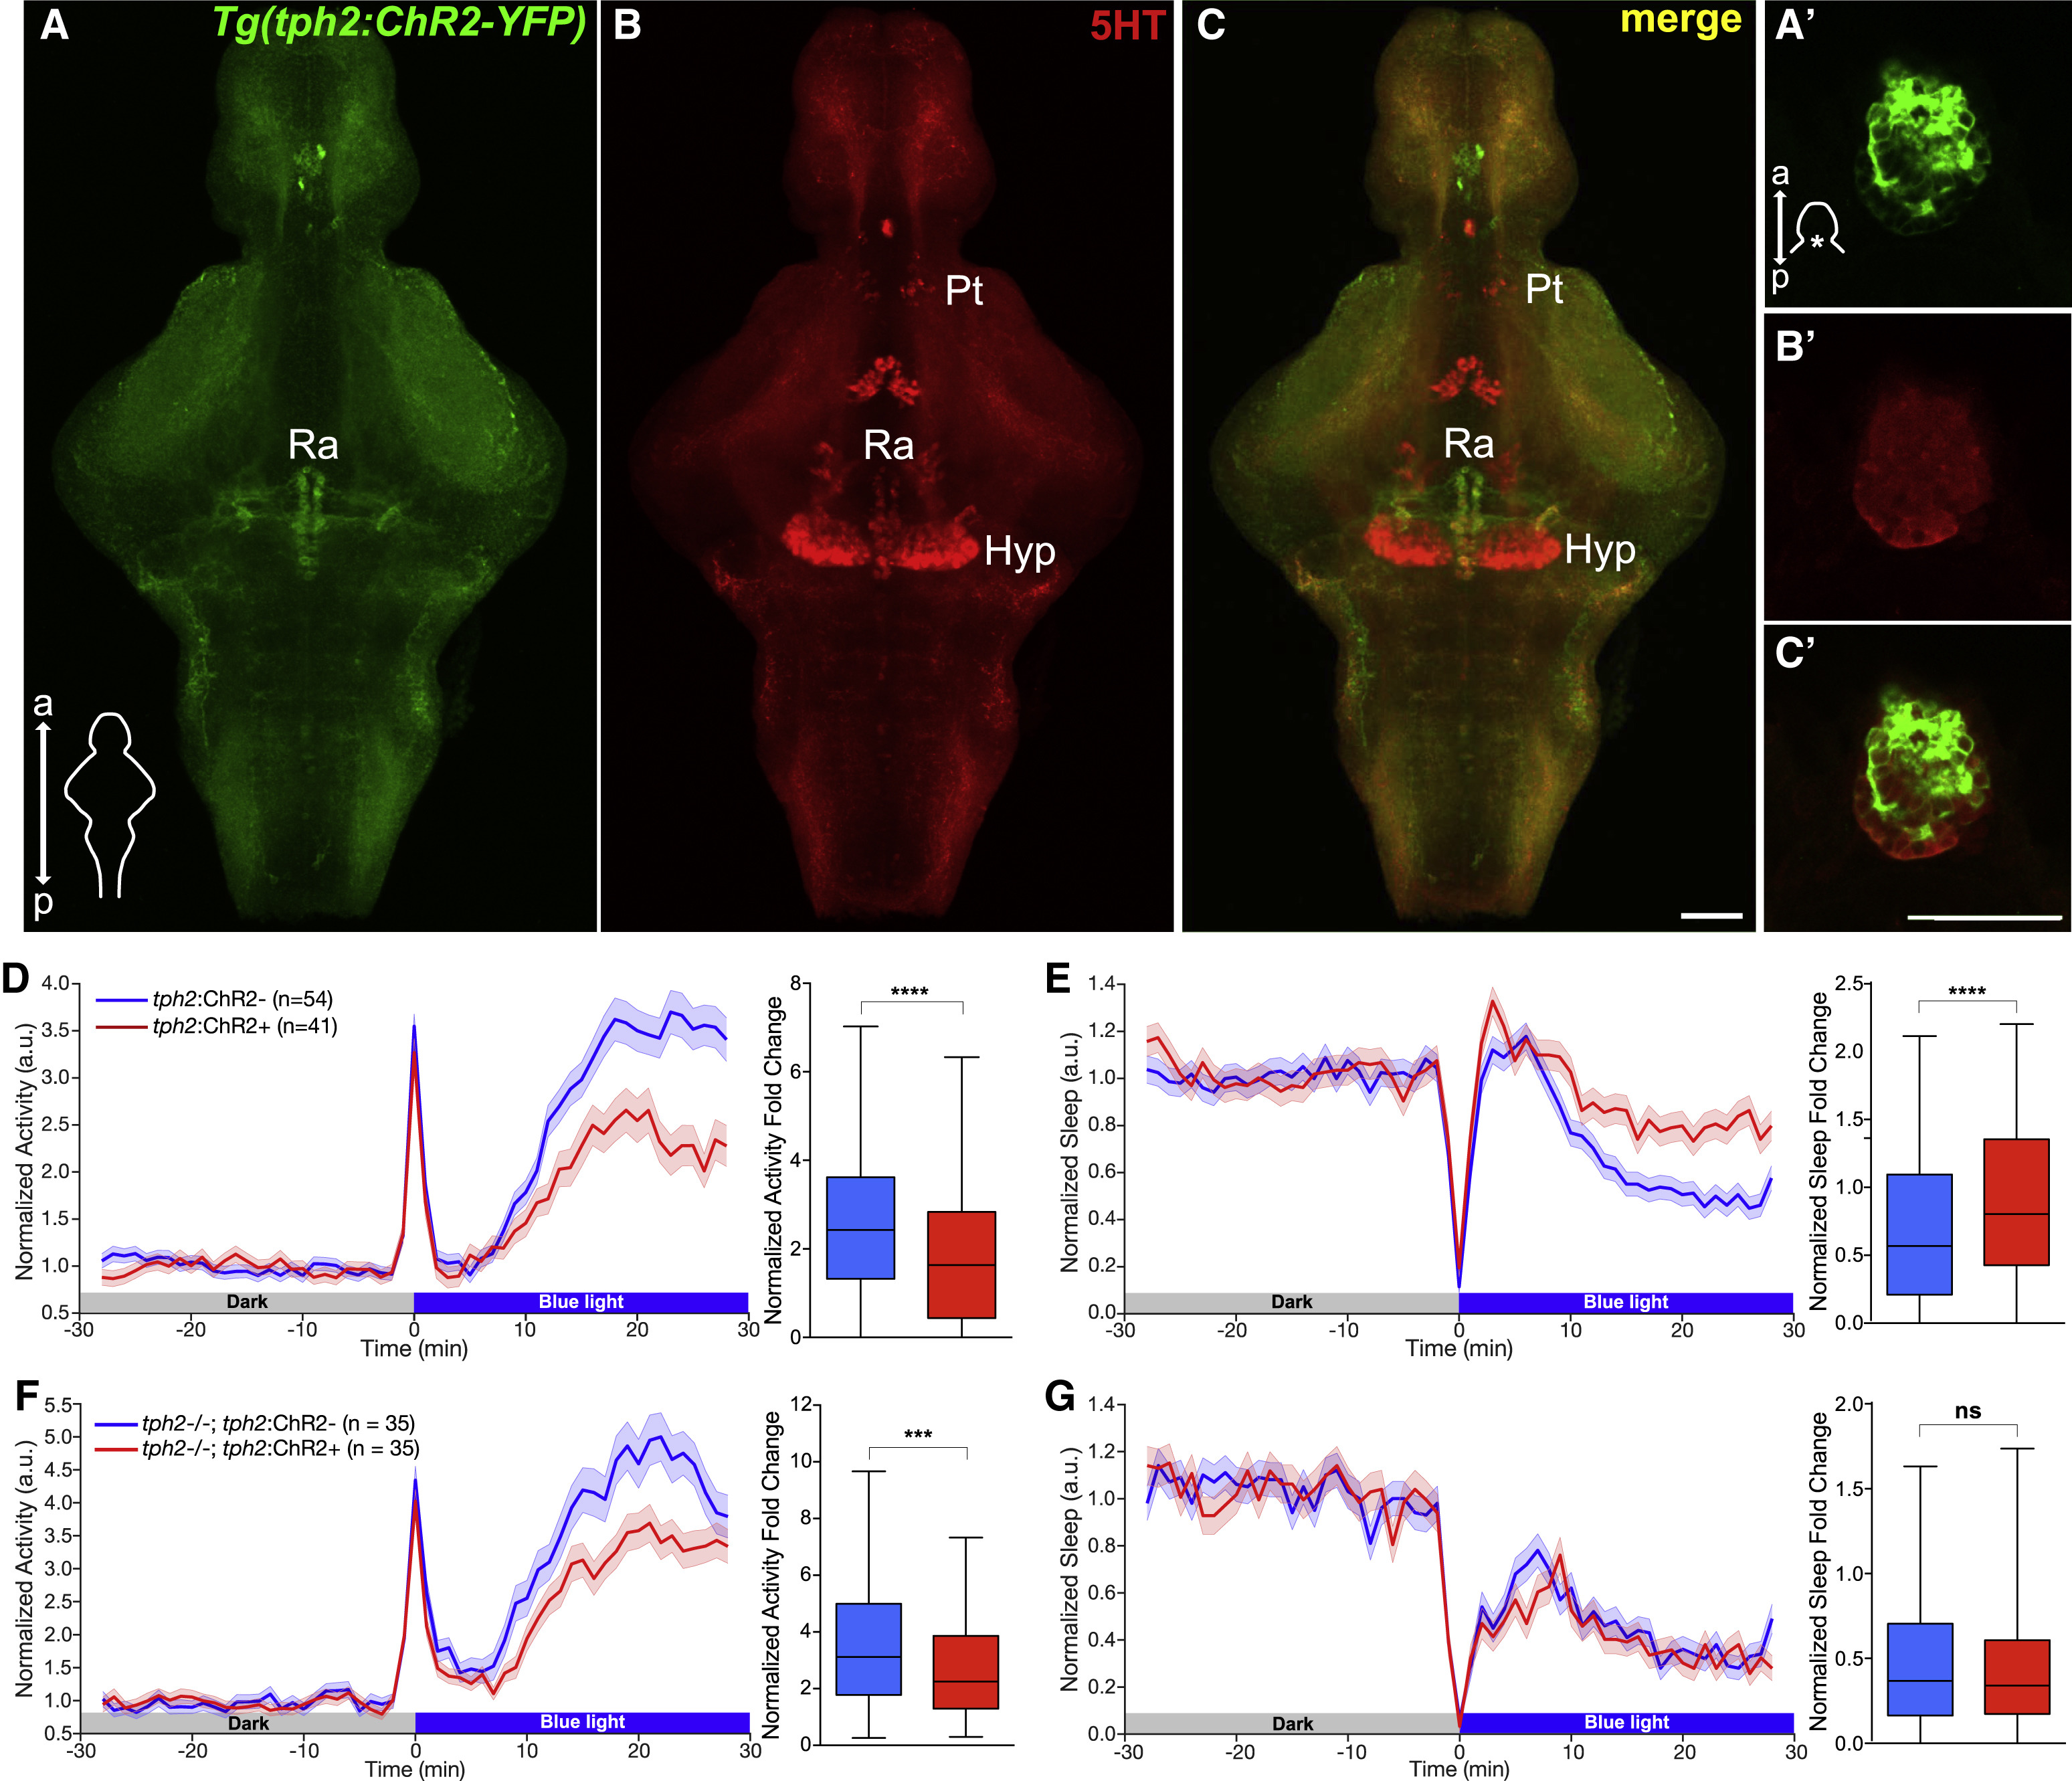
Fig. 4
Optogenetic Stimulation of the Raphe Results in Reduced Locomotor Activity and Increased Sleep in Zebrafish
(A–C′) Maximum intensity projections of brains (A–C) and single plane images of pineal glands (A′–C′) from 5 dpf Tg(tph2:ChR2-YFP) zebrafish immunostained for 5-HT and YFP. Scale bars, 50 μm. a, anterior; p, posterior; Pt, pretectal area; Hyp, hypothalamus; Ra, raphe.
(D and E) Left: normalized locomotor activity (D) and sleep (E) of 5 dpf Tg(tph2:ChR2) (red) and non-transgenic sibling control (blue) zebrafish before and during exposure to blue light. Right: normalized locomotor activity (D) and sleep (E) fold change during illumination.
(F and G) Same as (D) and (E) but in tph2−/− animals.
n, number of animals; 6 trials per animal. ns p > 0.05, ∗∗∗p < 0.001, ∗∗∗∗p < 0.0001, Mann-Whitney test.