
|
Fig. 3
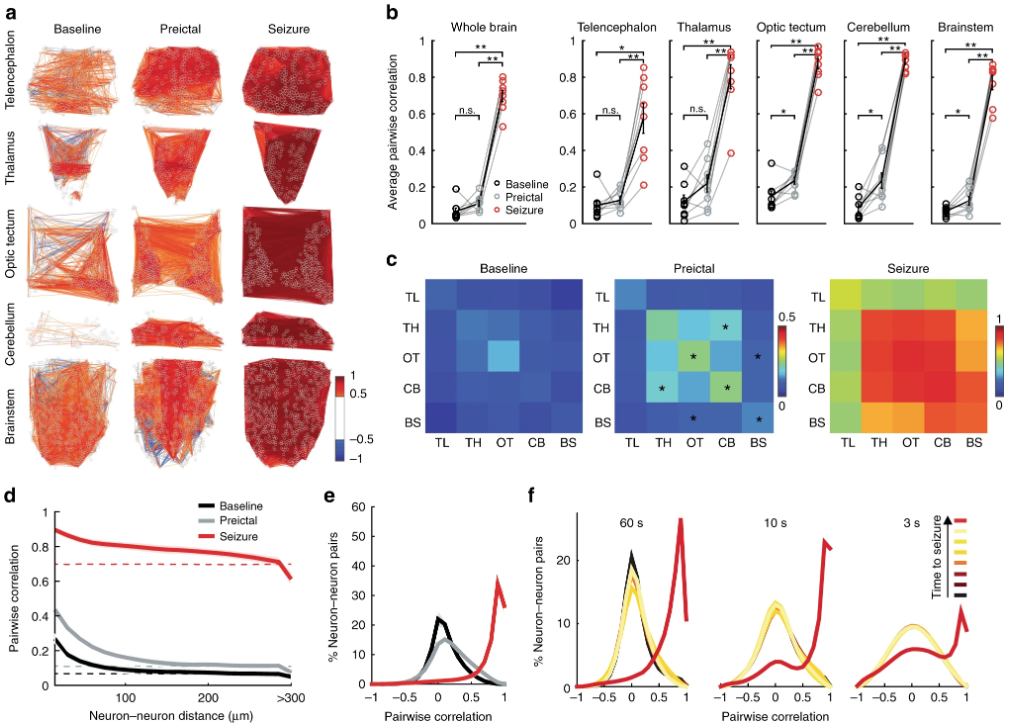
Functional connectivity between neurons changes abruptly from the preictal period to the generalized seizure. a A map depicting pairwise Pearson’s correlation coefficients of neural activity within brain regions during baseline, preictal and seizure periods. Each colored line indicates a strong positively (>0.5 in red) or negatively (<−0.5 in blue) correlated activity between pairs of neurons located at the end of the lines. b Average pairwise Pearson’s correlation during baseline (black), preictal (gray), and seizure (red) periods across the whole brain, and within individual brain regions. c Correlation matrices indicating average pairwise Pearson’s correlations of neural activity during baseline, preictal and seizure, across brain regions (telencephalon, TL; thalamus, TH; optic tectum, OT; cerebellum, CB; and brainstem, BS). Warmer colors indicate stronger positive correlations. d Relation between pairwise correlation of neural activity and distance between each neuron pair. Dotted lines represent the results when neural locations are shuffled. e Histogram representing the distribution of all correlation coefficients between neurons from all animals during baseline (black), preictal (gray), and seizure periods (red). fCorrelation coefficients during seven time periods immediately preceding a generalized seizure. The time periods are of 60, 10, and 3 s length, respectively. Lighter colors indicate temporal proximity to the seizure. **p = < 0.01, *p = < 0.05, ns = not significant, Wilcoxon signed-rank test. Error bars (b) and shaded regions (d–f) represent the s.e.m. of n = 8 fish