
|
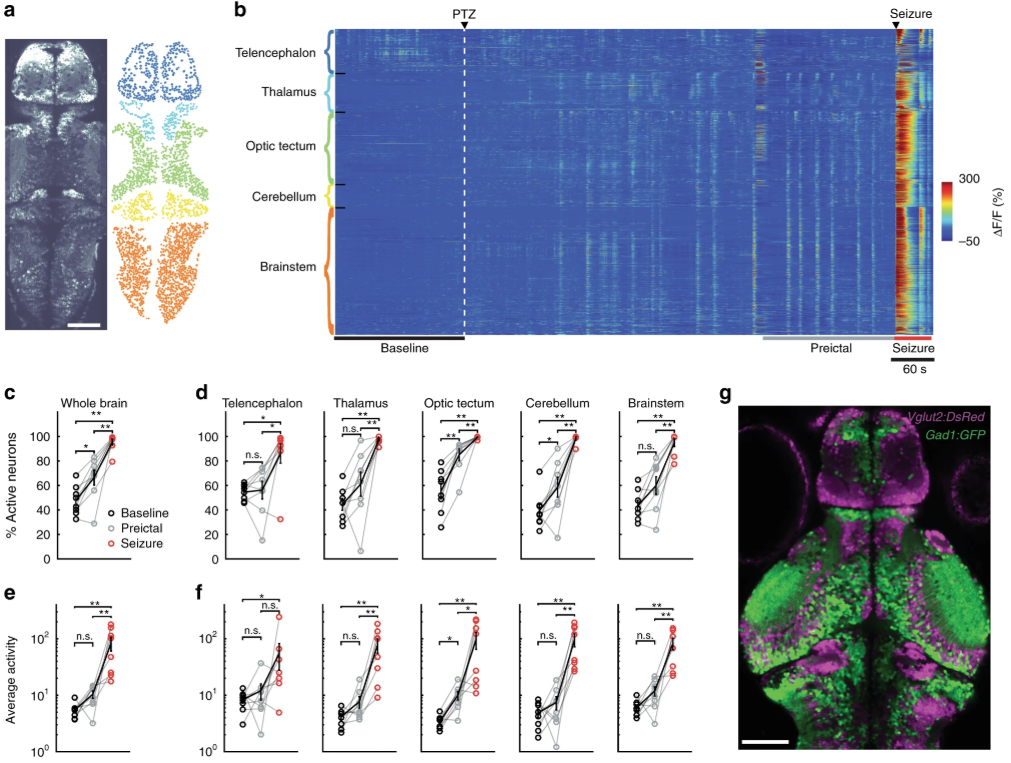
Fig. 2
Brain regions are differentially recruited during epileptic activity. a An optical section of a zebrafish larva expressing GCaMP6sin all neurons, obtained by two-photon microscopy, dorsal view (left). Individual neurons (right) in color-coded brain regions: telencephalon (dark blue), thalamus (light blue), optic tectum (green), cerebellum (yellow), and brainstem (orange). b Activity of individual neurons (ΔF/F) over time, organized by brain region. White dashed line indicates the start of 20 mM pentylenetetrazole (PTZ) perfusion. Warmer colors indicate stronger activity. c, d Percentage of active neurons (>3stdbaseline) in the whole brain (c), and per brain area (d) during baseline (black), preictal (gray) and seizure periods (red). e, f Average activity of the active neurons, defined by the area under the curve of the ΔF/F trace, in the whole brain (e) and per brain area (f). g Confocal image of Tg(gad1:GFP);Tg(vglut2a:dsRED) double transgenic zebrafish larva showing glutamatergic (magenta) and GABAergic (green) neurons. White bars reflect 100 µm. **p = < 0.01, *p = < 0.05, ns = not significant, Wilcoxon signed-rank test. Error bars (c-f) represent the s.e.m. of n = 8 fish, where 2012.6 ± 238.7 (mean ± SEM) neurons/fish were analyzed