
|
Fig. S4
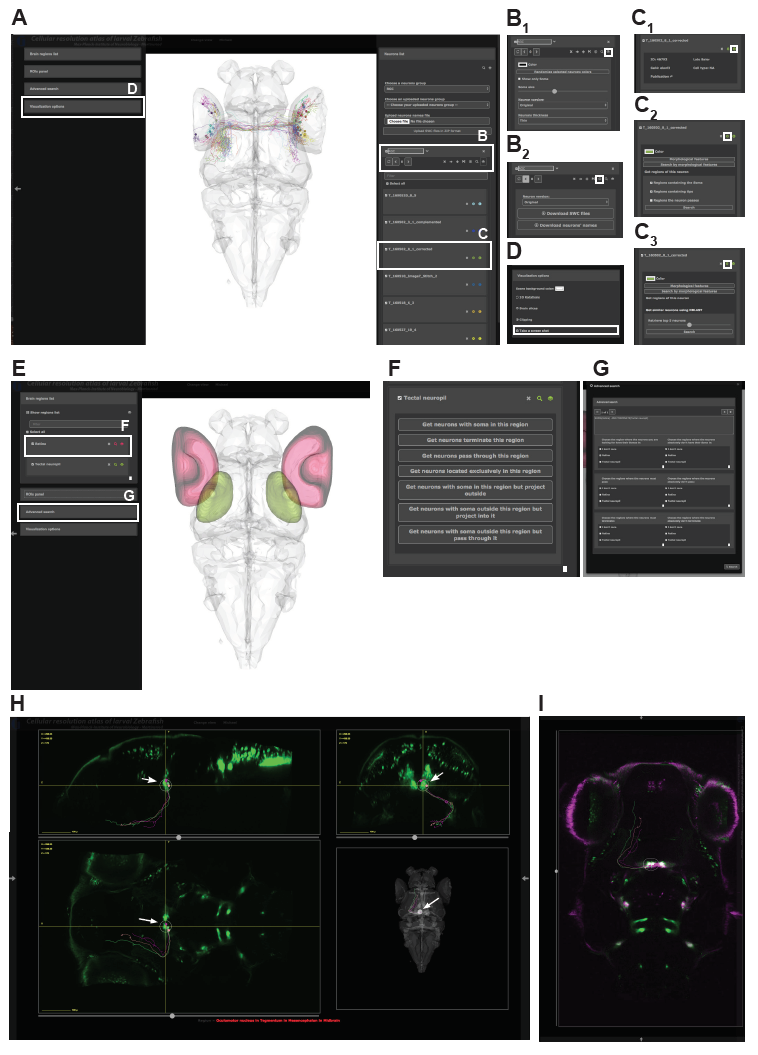
An interactive web-portal to explore single neuron data.
(A) Interactive 3D viewer showing individual RGCs. White boxes indicate specific submenus to manipulate neurons and letters refer to figure panels with further explanation. (B-D) Specific submenus highlighted in (A). White box indicates icon that needs to be clicked to expand the menu and show option. (B) Manipulation of entire neuron groups. (B1) Visualization options for all selected neurons in a group. Users can change the color, show only the soma and also change the size of the displayed soma, flip the entire group to one hemisphere and adjust the thickness level of neurites. (B2) All selected neurons can be either downloaded as .swc files or their names can be downloaded into a text file that can be later uploaded to our website to only display those neurons. When downloading the tracings as a .swc file, the user can choose to download them in their original state or flipped to one of the two hemispheres. (C) Manipulation of single neuron tracings. (C1) Each neuron has metadata attached to it including a unique ID, the lab of origin, the Gal4-line that drove expression in that neuron, the cell-type (if already known), as well as the publication (in the form of a hyperlink), in which the tracing was originally described. (C2) For each individual neuron it is possible to display the brain regions innervated by it. Users can limit their search to specific parts of the neuron. (C2) Once a neuron of interest was found users, can look for neurons with a similar morphology using NBLAST. (D) Users can export the current 3D view by taking a screenshot and saving the image to their hard drive. (E-G) Atlas based search functions. (E) Interactive 3D viewer showing selected brain regions. In this case we chose the retina (red) and tectal neuropil (green). White boxes indicate specific submenus to manipulate search function and letters refer to figure panels with further explanation. (F) Options to search for neurons in a single brain region. (G) Advanced search options for multiple brain regions. Users can perform simple AND/OR search functions and can specify to only for search for specific parts of the neuron in each brain region. (H) User-defined ROI search function guided by a specific expression pattern. In this case we used Chat:Gal4 to visualize cranial nuclei in green. Arrows indicate the position of the ROI in the oculomotor nuclei with the accompanying oculomotor neurons resulting from a search for neurons with their soma within that ROI. (I) Overlay of Chat:Gal4 and isl1:GFP