
|
Fig. S2
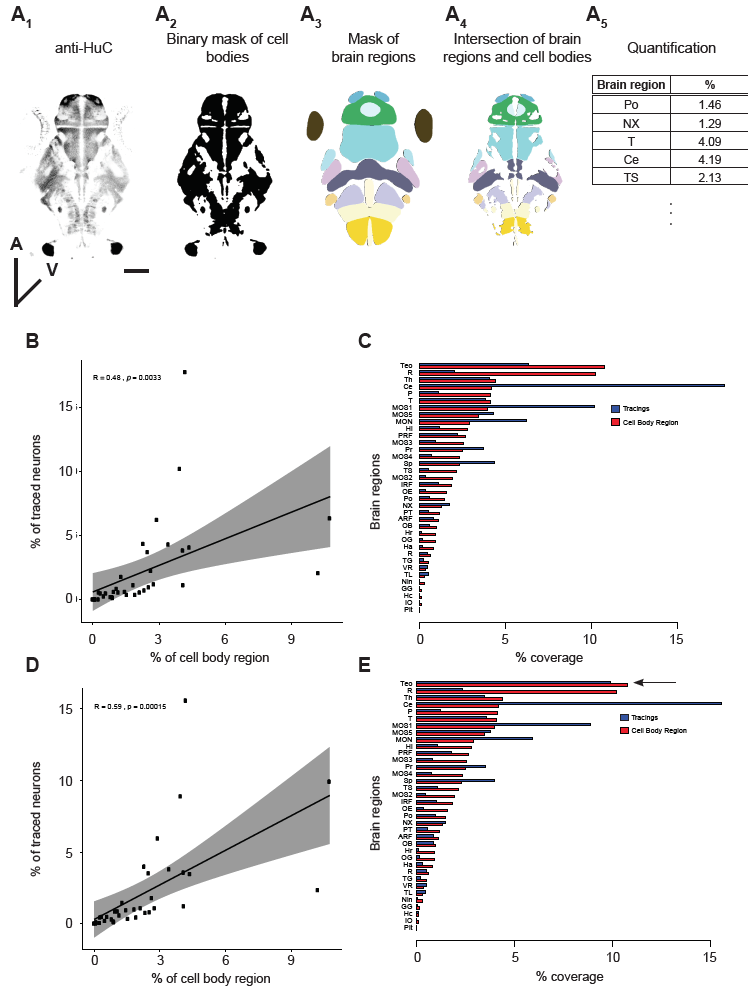
Analysis of labeling bias.
(A) Workflow to calculate the expected relative contribution of each brain region to the single-neuron database. Neuronal cell bodies were labeled using an antibody directed against the post-mitotic marker HuC/D (A1). The staining was converted into a binary mask (A2) and this mask was intersected with a mask of 36 brain regions (A3). The result of this intersection is a mask that contains only the cellular portions of each brain region (A4). Based on this, we calculated the volume of each brain region in relation to the total volume (A5). Scale bar represents 100 μm. (B and C) Scatterplot (B) and barplot (C) showing correlation between the cell body region and the soma of traced neurons for individual brain regions for the pan-neuronal dataset. (D and E) Same as in B and C but for the complemented dataset.