
|
Fig. 2
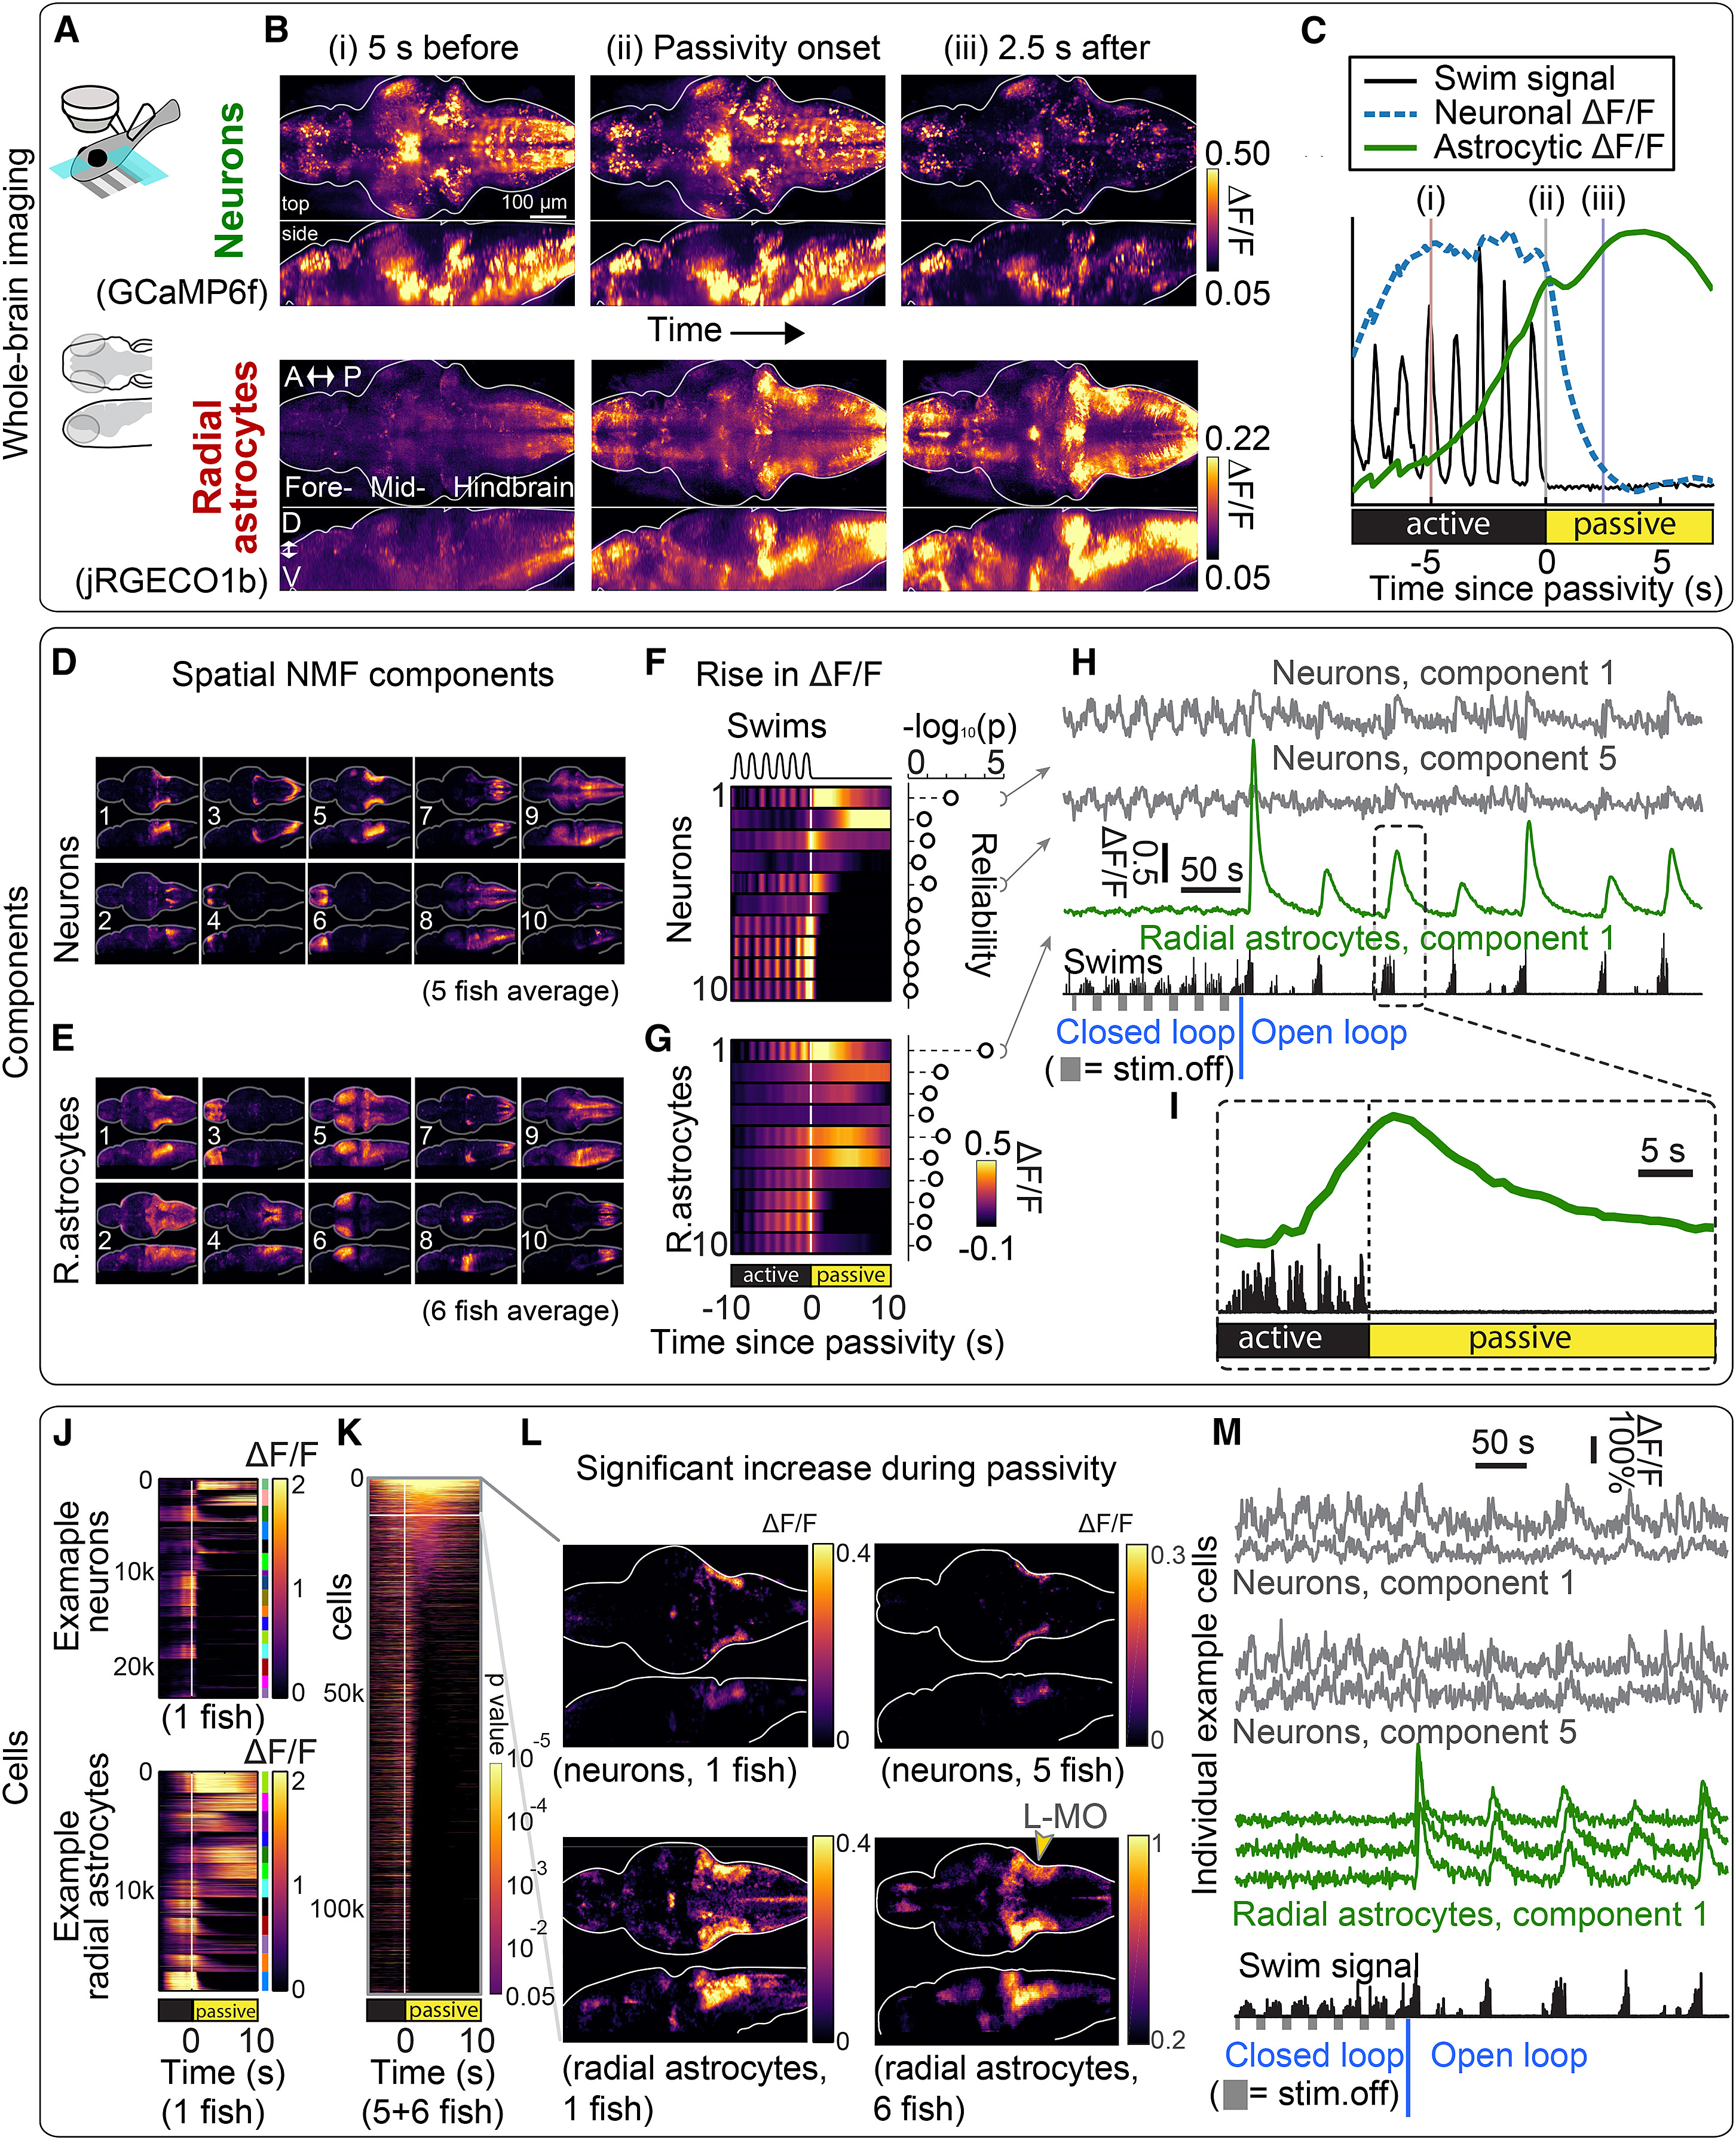
Whole-Brain Neuronal and Astrocyte Dynamics Show Ca2+Increases in Specific Cell Populations during Futility-Induced Passivity
(A) Experimental setup. A light-sheet microscope recorded from most radial astrocytes and neurons in the brain at cellular resolution, using either single-population GCaMP6f or simultaneous dual-color GCaMP6f and jRGECO1b recordings, while fictive behavior was monitored and visual stimulus was delivered.
(B) Whole-brain neuronal and glial activity before, at, and after passivity onset in an example Tg(gfap:jRGECO1b); Tg(elavl3:GCaMP6f)fish. Top: mean neuronal brain-wide activity was higher during active behavior than passivity. Bottom: conversely, mean brain-wide glial Ca2+signals increased before passivity onset and remained elevated during passivity. A, anterior; P, posterior; D, dorsal; V, ventral. Images are maximum-intensity projections of means triggered on passivity onset (64 events).
(C) Neuronal and glial signals near passivity onset, averaged across the brain of the same fish from (B). Average neuronal Ca2+ decayed after passivity onset, while average glial Ca2+ increased before passivity onset and peaked soon after.
(D and E) Spatial NMF components. Neuronal and glial data recorded with GCaMP6f in separate transgenic lines. Brightness: spatial NMF weights. n = 5 fish (neurons), n = 6 fish (radial astrocytes).
(F and G) Temporal neuronal and glial Ca2+ signals, per NMF component of (D) and (E), averaged over fish and trials, centered on passivity onset. Right: reliability (–log10(p)), calculated by comparing Ca2+ activity 1–4 s after passivity onset to mean activity 10–5 s before passivity onset (higher reliability: more consistent responses over trials). Multiple neuronal and glial components had strong correlations to behavior. Neuronal and glial component 1 overlaps with L-MO.
(H) Signals from example fish; see also Figure S2B. Fish was first in closed loop, presented with alternating moving and stationary gratings (fish swam little during stationary gratings), and next in open loop, wherein animals cycled through active and passive states. Radial astrocytes were engaged in switches to passivity in open loop, not swim pauses in closed loop.
(I) Astrocytic signal from (H), showing a rise before and peak after passivity onset.
(J) Cellular signals from segmented neurons and glia from two example fish, grouped by component (colored bars, right), relative to passivity onset.
(K) Neurons and glia (random subset) from all fish with elevated signals after passivity onset, ordered by p value from a statistical test of how reliably Ca2+ is increased above baseline (10–5 s before passivity).
(L) Brain maps of neurons and radial astrocytes with reliably elevated Ca2+ just after passivity onset (1–4 s) relative to baseline. L-MO signals were most consistently above baseline across fish. Left: example. Right: population average (5 fish for neurons, 6 for glia, registered to standard brain). p values were not used to test statistical significance but to create an exploratory functional brain map (STAR Methods).
(M) Ca2+ traces from single cells, same fish as in (H) and (I), during closed loop (left) and open loop (right). Radial astrocytes selectively respond to futility-induced passivity.
Reprinted from Cell, 178(1), Mu, Y., Bennett, D.V., Rubinov, M., Narayan, S., Yang, C.T., Tanimoto, M., Mensh, B.D., Looger, L.L., Ahrens, M.B., Glia Accumulate Evidence that Actions Are Futile and Suppress Unsuccessful Behavior, 27-43.e19, Copyright (2019) with permission from Elsevier. Full text @ Cell