
|
Fig. 6
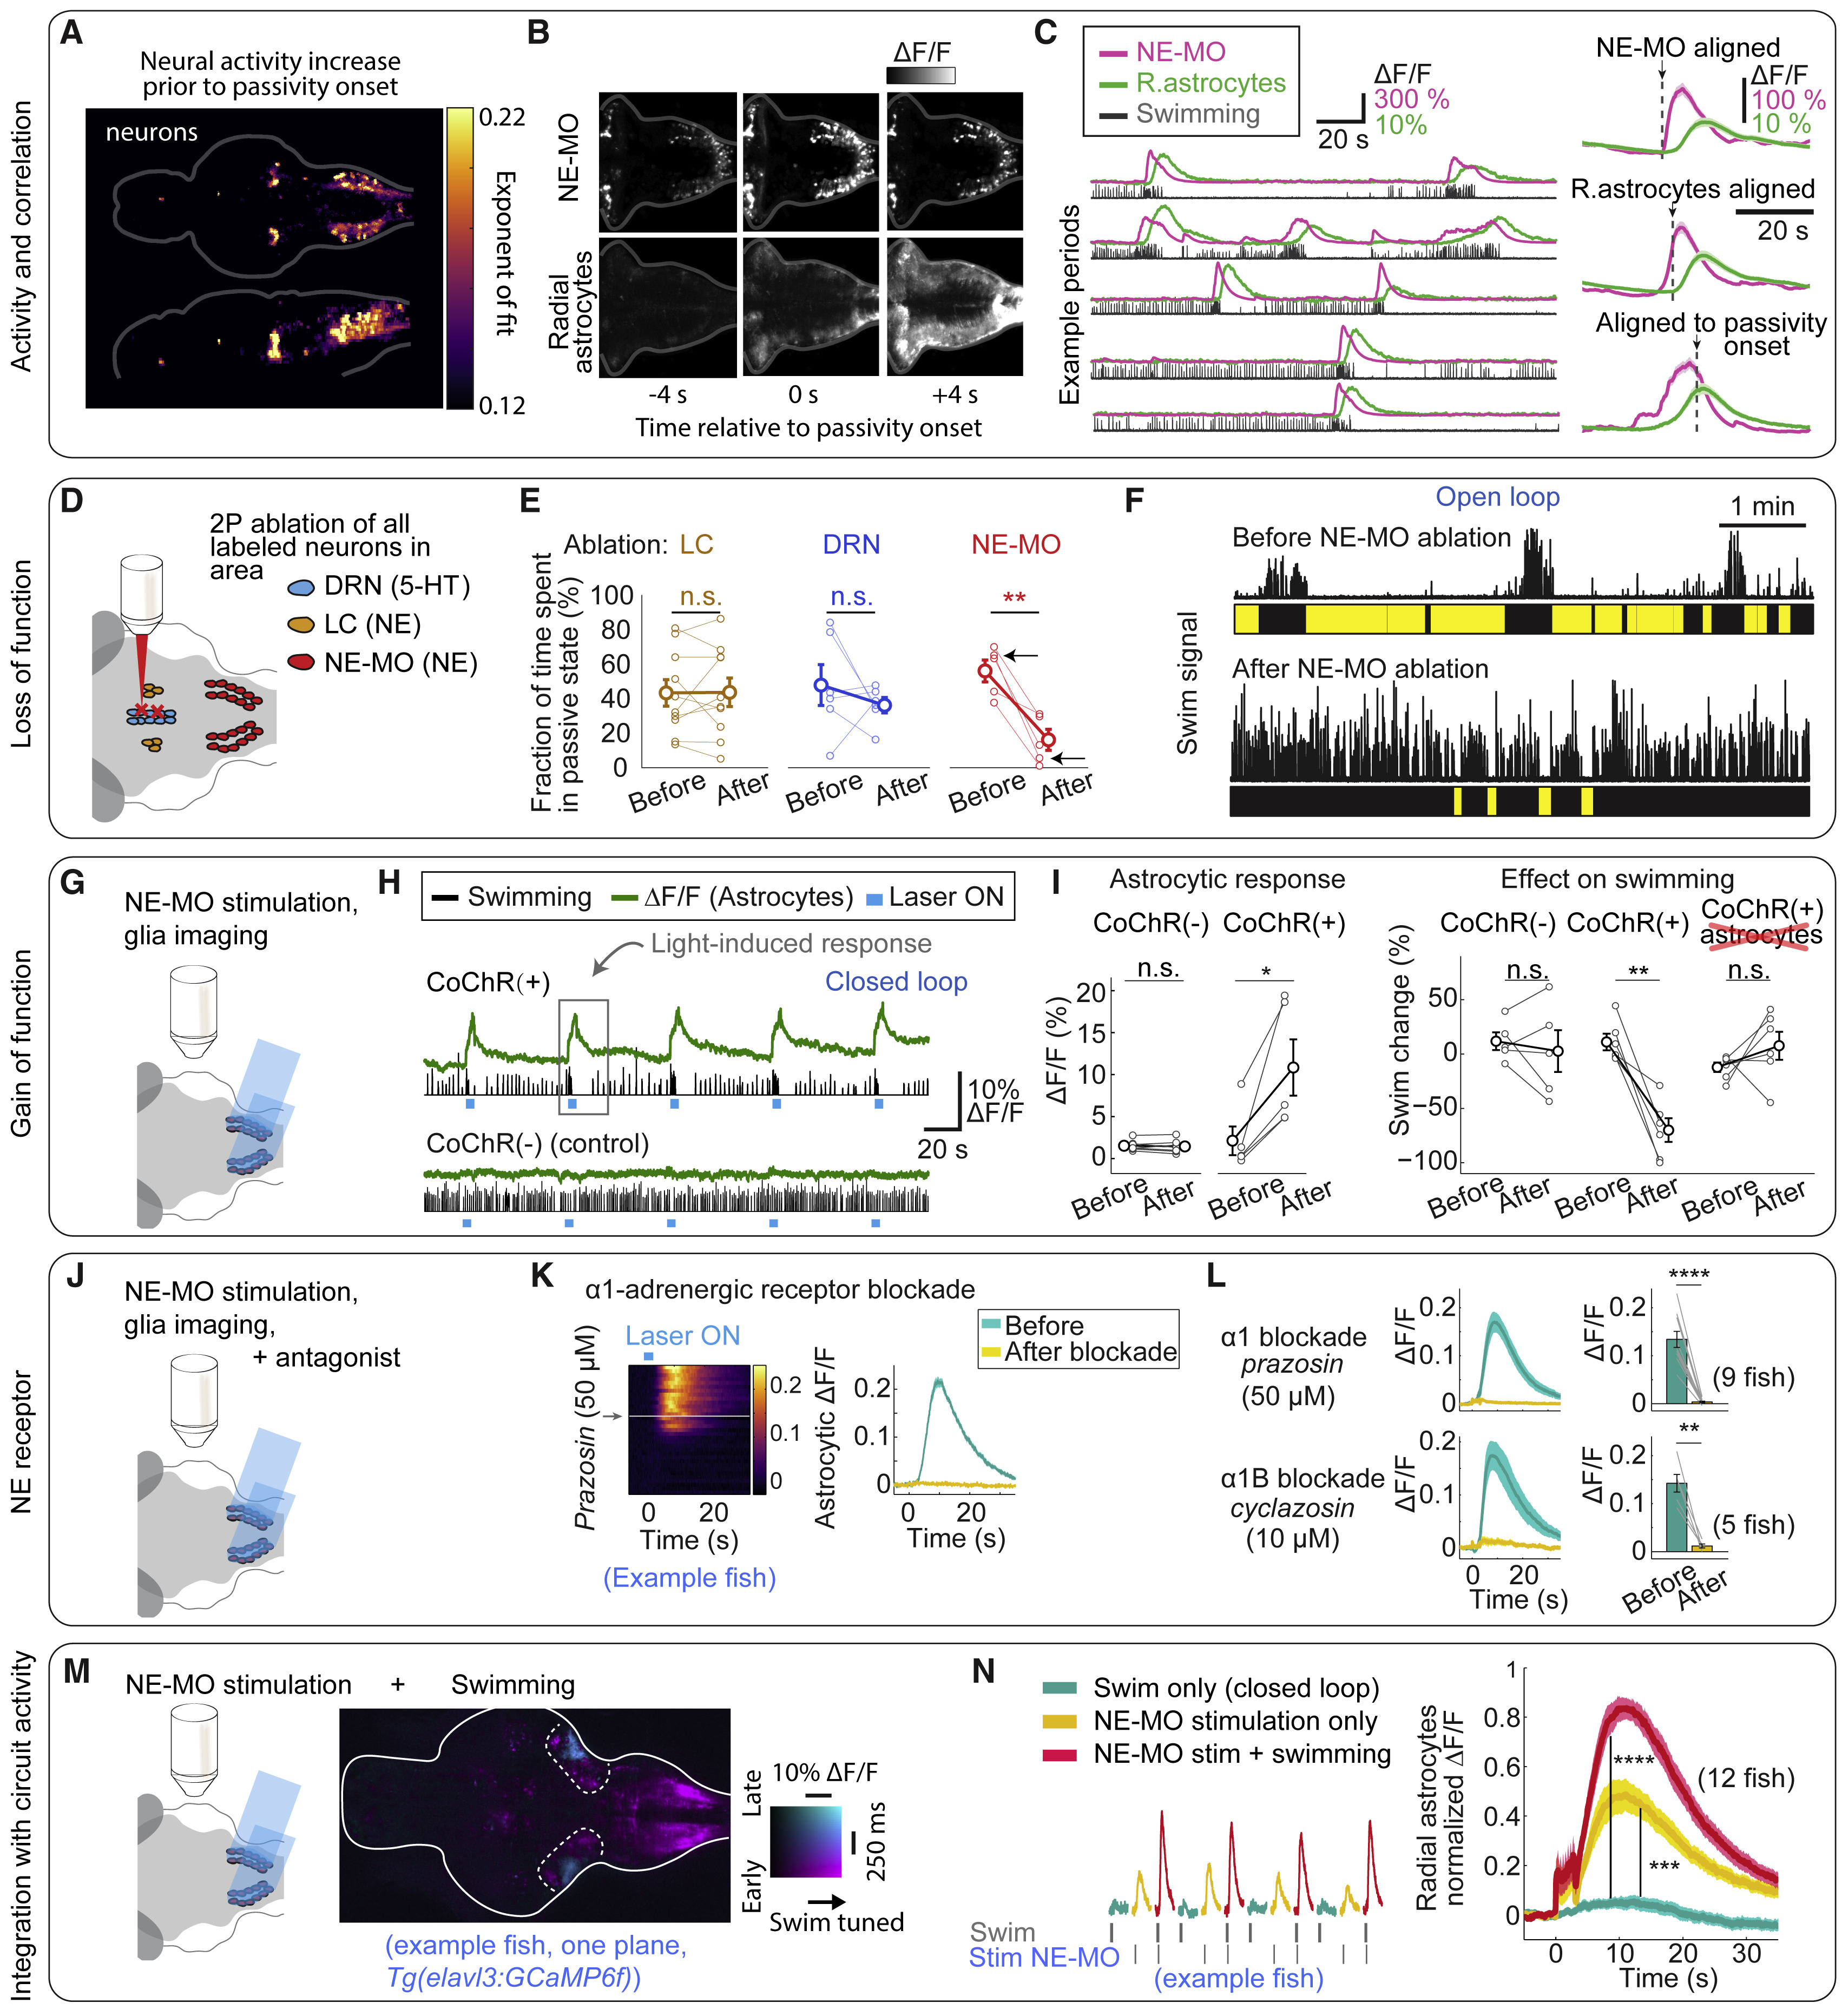
Noradrenergic System Activates Radial Astrocytes and Is Required for Futility-Induced Passivity
(A) Rate of neuronal activity increase before passivity onset quantified by the exponent of an exponential fit to average Ca2+ signals before passivity (overlay of 5 fish, Tg(elavl3:GCaMP6f)). Population with the highest rate of increase overlaps with NE neurons (see Figure S6A).
(B) Simultaneous imaging of NE neurons and radial astrocytes. Example Ca2+ signals just before, at, and after passivity onset.
(C) Examples of NE-MO activity, glial Ca2+ increases, and swimming in an alternating closed- and open-loop protocol. Right: average Ca2+activity from NE-MO and radial astrocytes, aligned to NE-MO response onset, radial astrocyte response, or passivity onset.
(D) Experimental design: single-cell 2-photon ablation of LC, NE-MO, or DRN in transgenic zebrafish labeling these nuclei.
(E) Time in passivity was strongly reduced after NE-MO ablation, but not after ablation of LC or DRN. Two-tailed paired t test, p = 0.95, n = 10 fish for LC; p = 0.40, n = 6 fish for DRN; p = 0.0070, n = 5 fish for NE-MO.
(F) Example shows NE-MO ablation reduced futility-induced passivity. Arrows in (E), corresponding data points.
(G) Experimental design: optogenetic activation of NE-MO cells using DMD-targeted light delivery in fish expressing CoChR in NE cells while imaging radial astrocytes expressing jRGECO1b.
(H) Example fish, NE-MO activation led to increased L-MO glial Ca2+, then passivity. Swimming increases briefly at light onset (see Figure S6D).
(I) Population data: NE-MO activation increased L-MO glial Ca2+ (left) and reduced swimming (right) in CoChR+ fish. Two-tailed paired t test, CoChR+ imaging, p = 0.025, n = 5 fish; CoChR+ behavior, p = 0.0024, n = 6 fish; CoChR− imaging, p = 0.52, n = 7 fish; CoChR− behavior, p = 0.56, n = 5 fish; glial ablation, p = 0.27, n = 6 fish.
(J) Experiment to identify receptors. Experiment as in (G) with NE receptor antagonists added to bath.
(K) α1 NE receptor antagonist prazosin (50 μM) abolishes radial astrocyte response evoked by NE-MO stimulation.
(L) Population data. α1 NE receptor antagonist prazosin (50 μM) or α1B antagonist cyclazosin (10 μM) abolished radial astrocyte responses. Two-tailed paired t test, prazosin, p = 4.6 × 10⁻⁵, n = 9 fish; cyclazosin, p = 0.0042, n = 5 fish. Shading, SEM.
(M) Experimental design to test whether L-MO radial astrocytes integrate NE and local circuit activity. In closed loop, NE-MO cells are optogenetically stimulated during swimming (higher L-MO neuronal activity), or during not swimming.
(N) Integration of NE and local circuit activity. Radial astrocytic Ca2+responses to NE during swimming are larger than to NE alone. Left: examples from successive trials. Right: summary of all fish. Two-tailed paired t test, p = 2.4 × 10⁻⁴ for NE-MO stimulation only versus swimming only, p = 2.4 × 10⁻⁸ for NE-MO stimulation + swimming versus swimming only, n = 12 fish. Shading, SEM.
Reprinted from Cell, 178(1), Mu, Y., Bennett, D.V., Rubinov, M., Narayan, S., Yang, C.T., Tanimoto, M., Mensh, B.D., Looger, L.L., Ahrens, M.B., Glia Accumulate Evidence that Actions Are Futile and Suppress Unsuccessful Behavior, 27-43.e19, Copyright (2019) with permission from Elsevier. Full text @ Cell